

The FullStack Alpha research desk tests AI trading bots on paper and live accounts. Reviewed and edited by Jay Rocco, Founder and Editor.
By FullStack Alpha Editorial Team | Reviewed by Jay Rocco, Chief Editor
Quantitative trading means using data, statistics and code instead of gut feel to decide what to buy and sell. You write a rule precise enough for a computer to follow, test it on history with costs included, check it on data it never saw, run it on a paper account, and only then risk a small amount of real money. That is six stages: idea, data, backtest, out-of-sample test, paper trading and a limited live test. Most beginners skip from idea straight to live money, and the out-of-sample stage is where most ideas quietly die: in our worked example below, a market-timing rule that beat buy-and-hold on 1929 to 2000 data lost to it on 2001 to 2025.
Key insights
- Quantitative trading is a subset of algorithmic trading: the rule comes from a statistical test, not just a hunch that got automated.
- QuantConnect says “more than 15,000 backtests are performed on QuantConnect daily,” per its homepage. Testing is cheap; honest testing is the hard part.
- Alpaca’s paper trading starts at $100,000 and, per its docs, does not account for market impact, slippage from latency, queue position or regulatory fees, and does not simulate dividends.
- In our worked example, the best in-sample version of a simple timing rule had a Sharpe ratio of 0.44 versus 0.39 for buy-and-hold, then 0.41 versus 0.48 out of sample.
- Decision rule: write the rule, write what would prove it wrong, then test. Never the other way around.
What Is Quantitative Trading?
Quantitative trading is the practice of using data, statistics and code to generate and execute trading decisions, instead of eyeballing charts or acting on a hunch. The rule is written down, tested on historical data and traded only if the numbers hold up.
That differs from discretionary trading, where a person reads price action, levels and news and makes a call in the moment. It also differs from plain algorithmic trading, which only means a computer places the order. Quantitative trading is a specific kind of algorithmic trading where the strategy itself comes out of a statistical process.
In practice:
- Discretionary trader: sees a tight consolidation, decides it looks like a breakout, buys.
- Algorithmic trader: writes “if price closes above the 20-day high, buy” and lets a script execute it. The rule may still have come from a hunch.
- Quantitative trader: tests that breakout rule across years and hundreds of stocks, measures win rate, average gain, drawdown and Sharpe ratio (return per unit of risk), and trades it only if the numbers survive costs and out-of-sample data.
What does a quant do all day? Less trading than you would think. Most of the work is cleaning data, testing hypotheses, writing code, and checking whether an idea still looks good after costs, after including stocks that no longer exist (survivorship bias), and on data the model never saw.
This is not a side door to easy money. It is a slower, more honest way to learn whether your idea was ever good. Most trading ideas are not. Quantitative trading tells you that before your account does.
What Are the 6 Stages of Quantitative Trading?
The path from idea to live capital runs through six stages, and each stage answers one question before you are allowed to move on. Skipping a stage is how beginners blow up accounts.
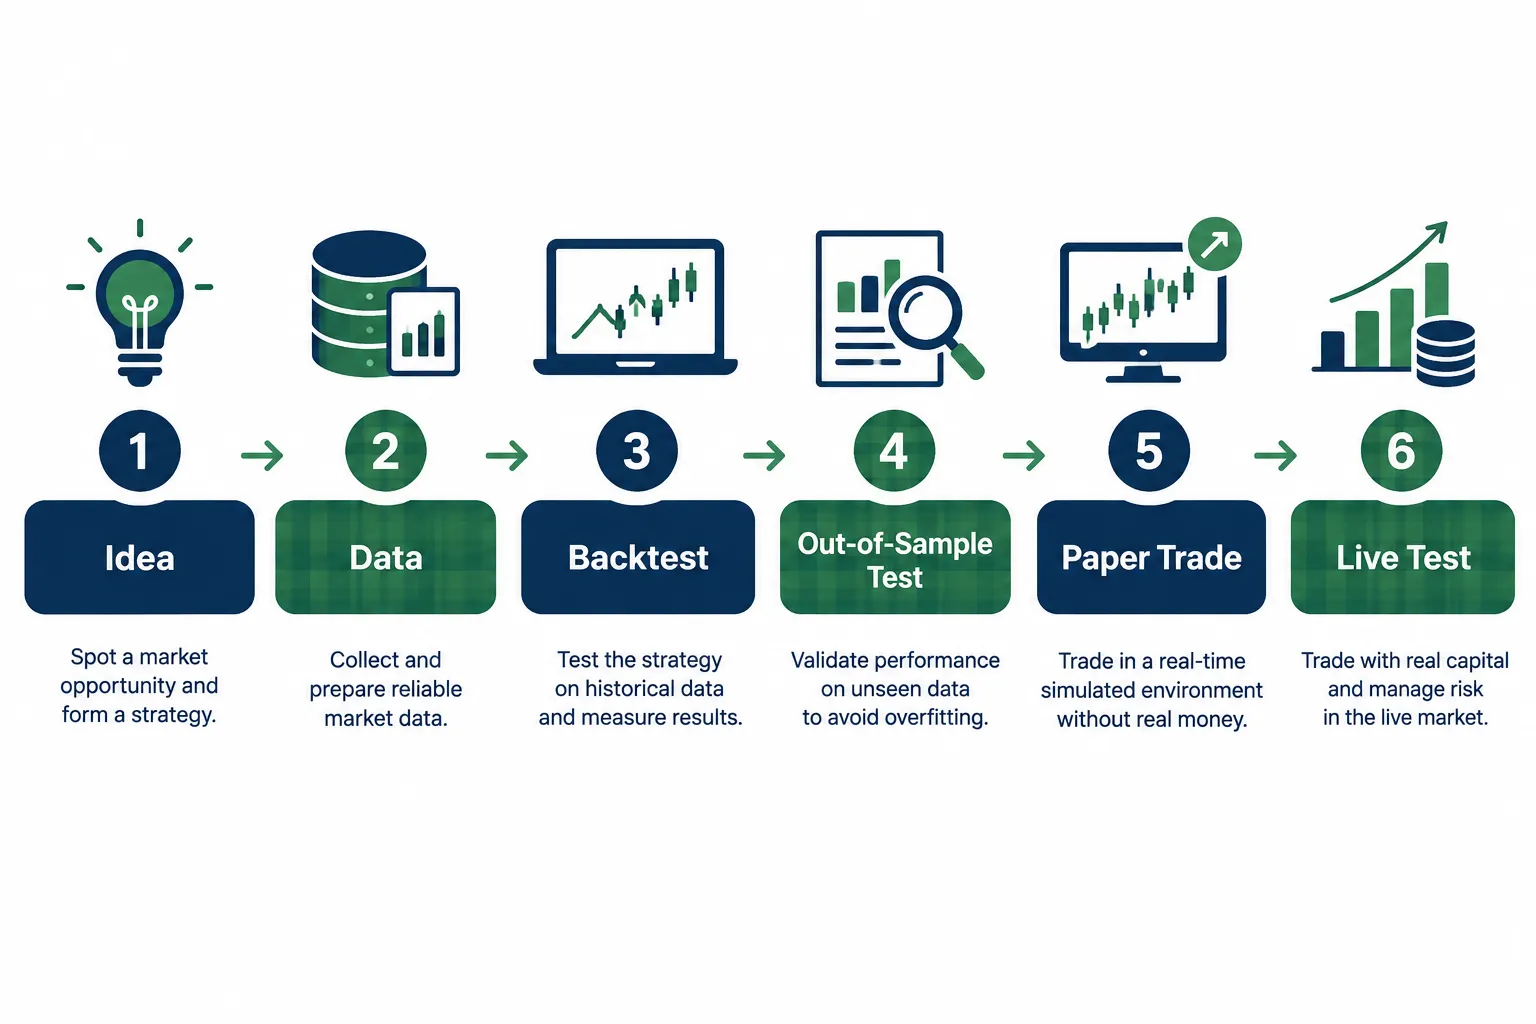
| Stage | Question It Answers | Tool | Common Mistake |
|---|---|---|---|
| 1. Idea | Is there a logical reason this should work? | Notebook, market observation | No economic reason, just a pattern that "looked cool" |
| 2. Data | Is the historical data clean and complete? | Python, adjusted price feeds | Unadjusted prices or data missing delisted stocks |
| 3. Backtest | Would this rule have made money, after costs? | Backtrader, QuantConnect | Ignoring slippage and commissions |
| 4. Out-of-sample test | Does it still work on data it never saw? | Held-out date range | Tweaking the rule until it fits the test data too |
| 5. Paper trading | Does the code run correctly with live data? | Alpaca paper account, broker simulator | Running it a few days, then going live |
| 6. Live, limited size | Does it survive real fills and real fear? | Small position size, strict stop loss | Sizing up immediately because paper results looked great |
Decision rule: if you cannot answer a stage’s question honestly, you are not ready for the next one. That is the whole discipline.
How Do You Turn a Trading Idea Into a Testable Rule?
A trading idea becomes testable when you can write it as a sentence with no wiggle room: a specific entry, a specific exit, a specific position size and a specific result that proves it wrong. If a person reading your rule still has to “use judgment,” it is not a quantitative trading rule yet.
Every rule needs four parts:
Entry condition. Not “buy on a breakout.” Instead: “Buy when the 10-day moving average crosses above the 50-day moving average and volume is at least 1.5 times its 20-day average.” Backtest engines need numbers, not adjectives.
Exit condition. How you get out of winners and losers. For example: “Sell on a 2% stop below entry, or after 10 trading days, whichever comes first.”
Position size. How much goes into each trade. A common beginner rule is to risk no more than 1% of account equity per trade, sized by the distance to the stop. Sizing often matters more than the entry; a great entry with reckless sizing still blows up an account.
Falsification condition. What result kills the idea. For example: “If the out-of-sample Sharpe ratio after costs is below 0.4, or the maximum drawdown is deeper than 25%, the idea is dead.” Decide this before you see results, not after.
Worked example: the position-size math
Your account is $10,000. You risk 1% per trade, so $100. Your stop is 2% below entry.
- Position size = $100 / 0.02 = $5,000
- At a $50 entry, that is 100 shares, with the stop at $49
- A stop-out loses about $100, plus commissions and any slippage
Now tighten the stop to 1% and the same rule says $10,000, your whole account, in one position. That is why a sizing rule needs a cap too: for example, no single position above 25% of equity. Write the cap into the rule, not into your head.
Here is a complete rule written the right way:
“On SPY only, buy at the close if price closes above its 20-day high and the 14-day RSI is below 70. Exit at the close five trading days later, or on a 3% stop, whichever comes first. Risk 1% of equity per trade, with no position above 25% of equity. If the out-of-sample Sharpe ratio after costs is below 0.4, the idea is dead.”
Compare that with “buy strong stocks on breakouts,” which is a feeling, not a system. If you cannot backtest it, you are guessing with extra steps. Our Python algorithmic trading roadmap shows how to turn a rule like this into code.
Where Do You Get Clean Data for Quantitative Trading?
Clean data for quantitative trading means prices adjusted for splits and dividends, with delisted and acquired companies included, from a source you trust enough to risk money on. Dirty data produces backtests that look great and mean nothing.
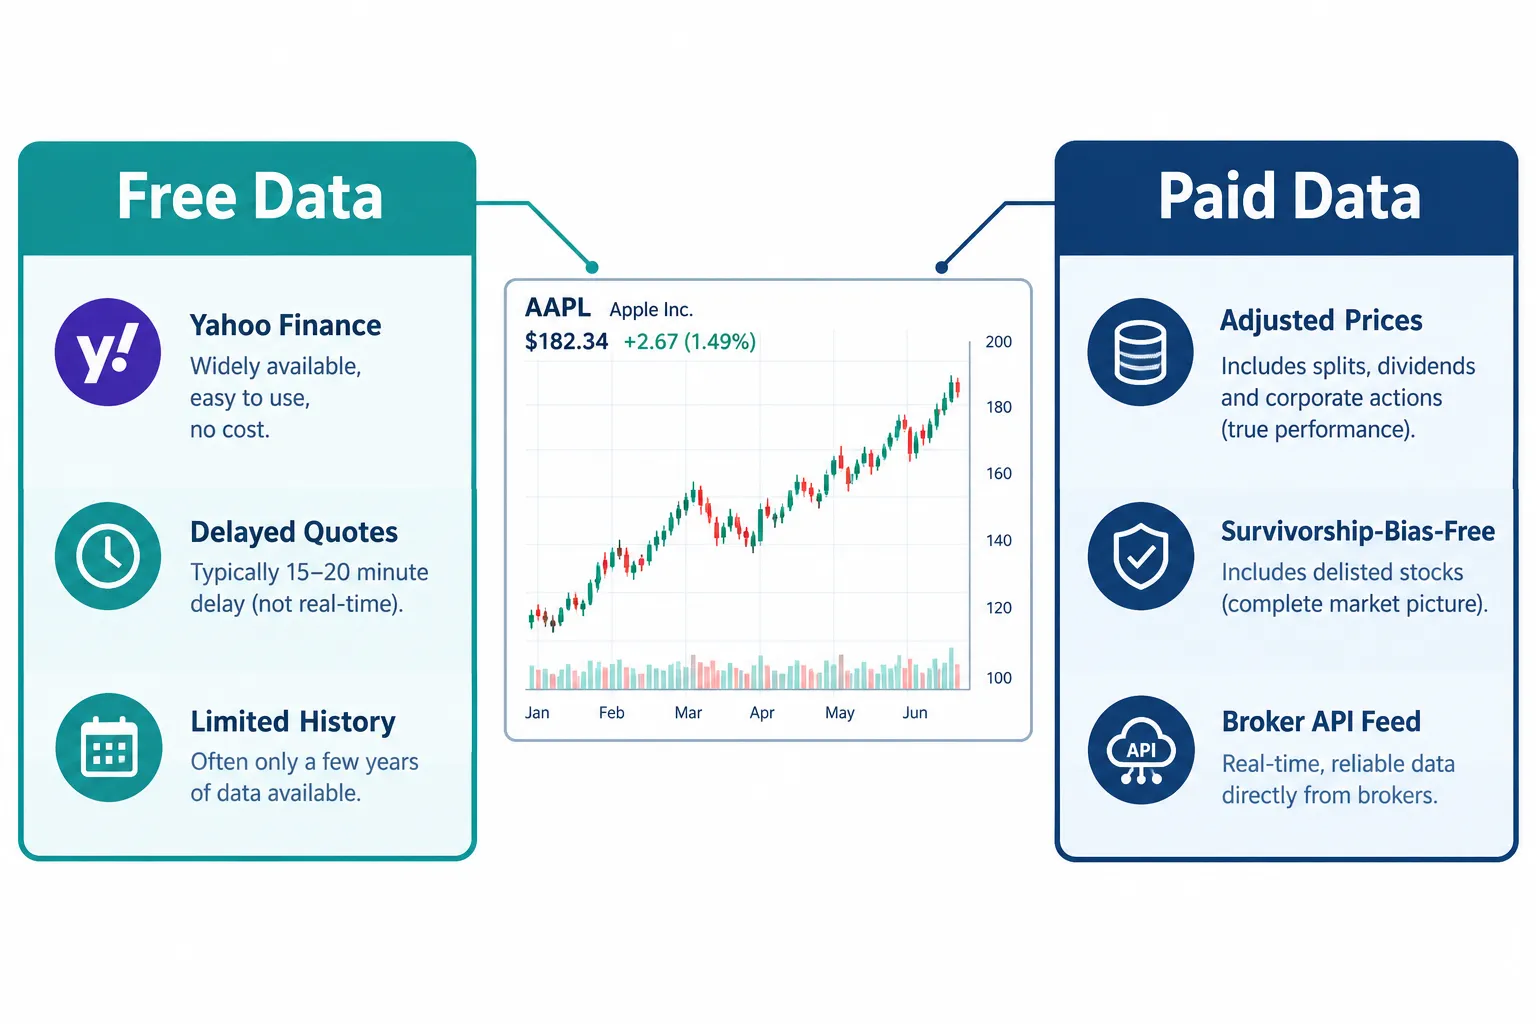
Free and low-cost sources are fine for learning:
- Broker APIs. Alpaca’s free plan includes historical bars from the IEX feed alongside paper trading, so your test data and live data come from the same source. Note that IEX is one exchange, not the full consolidated tape.
- Community libraries such as yfinance pull Yahoo Finance data. They are unofficial, so check coverage and terms before you build anything serious on them.
- Annual history for big-picture tests. NYU Stern professor Aswath Damodaran publishes annual S&P 500, T-bill and bond returns back to 1928. We use it in the worked example below.
Paid sources matter once you test more than a few tickers: point-in-time fundamentals (data exactly as it was known on each date), survivorship-free stock universes and clean corporate-action histories. Alternative data, such as the congressional trading and insider data tracked by Quiver Quantitative, can add signals, but quality and predictive value vary a lot by dataset.
Two traps kill beginner backtests before they start:
- Survivorship bias. If your data contains only companies that still exist, the backtest never sees the ones that went to zero, and results look better than reality.
- Unadjusted prices. A 2-for-1 split that is not adjusted shows up as a 50% overnight crash in your data. One bug like that can wreck a backtest more thoroughly than bad strategy logic.
Decision rule: if you cannot confirm your data adjusts for splits and dividends and includes delisted names, do not trust any backtest built on it.
How Do You Backtest a Quantitative Trading Strategy?
Backtesting a quantitative trading strategy means running your rule on historical data with costs included, then checking whether the result holds on data the rule never touched during design. Skip the out-of-sample check and you are curve-fitting with extra confidence.
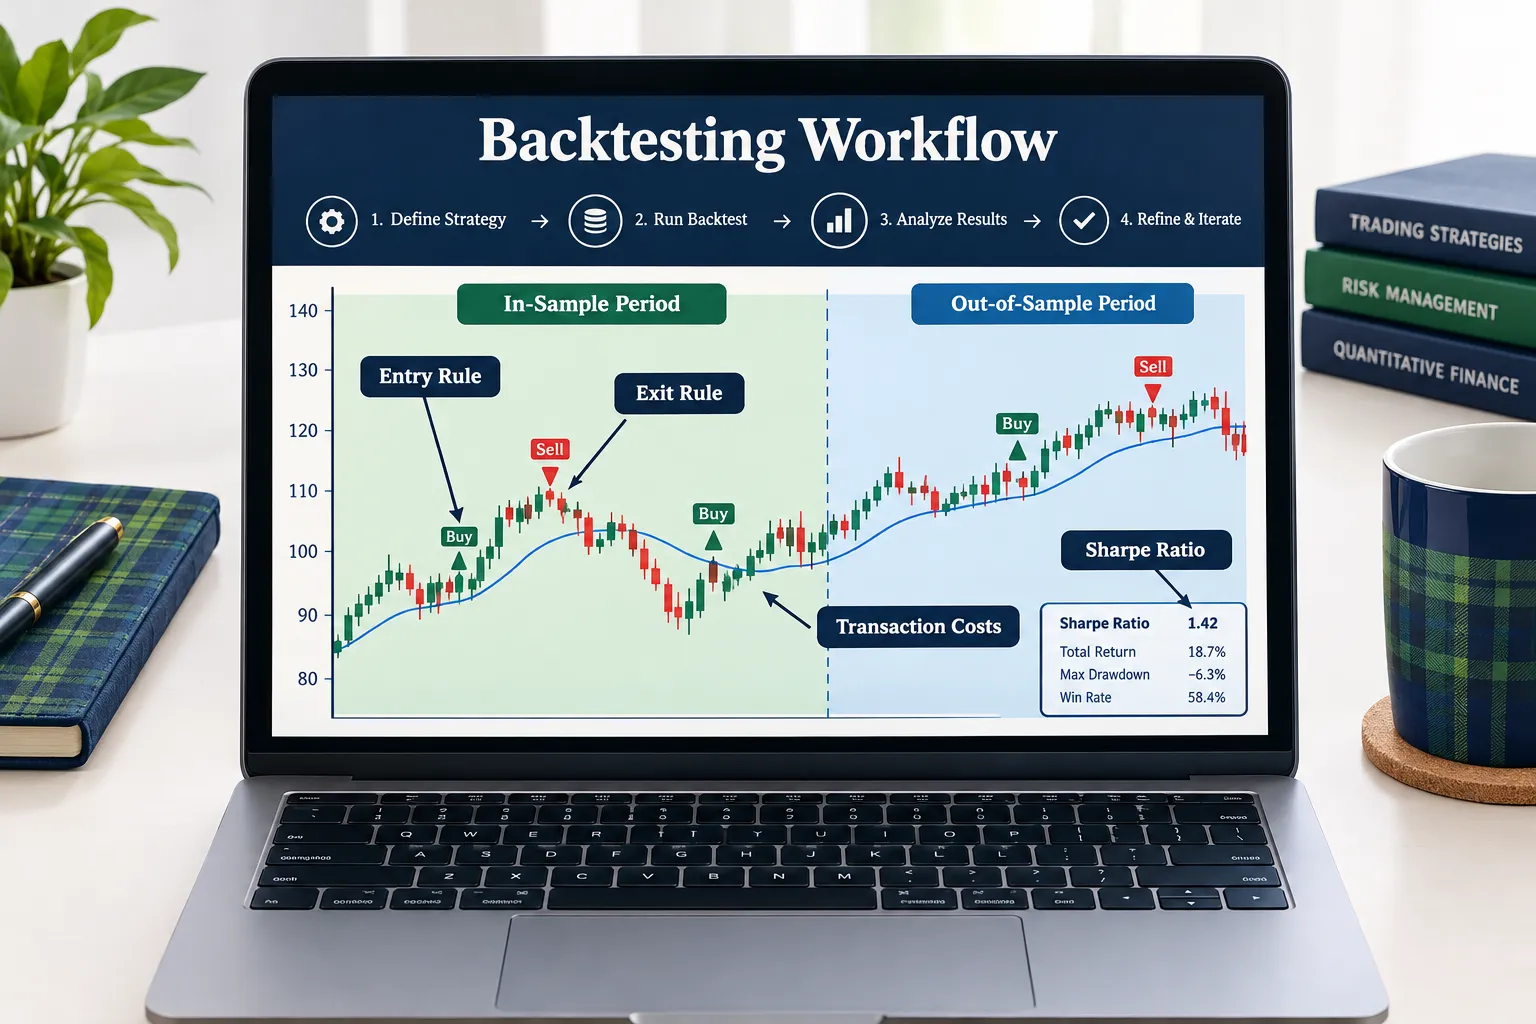
- Split your data. Use the earlier part to build and tune the rule (in-sample) and lock away the later part (out-of-sample).
- Build and tune on in-sample data only.
- Deduct real costs. Commissions, the bid-ask spread, slippage (the gap between the price you wanted and the price you got) and, for leveraged positions, financing.
- Run the out-of-sample data once. Same rule, no further tweaks. If performance falls apart, the in-sample result was overfitting: the rule was tuned to noise.
- Judge risk-adjusted results. Look at Sharpe ratio and maximum drawdown, not just total return. Our guide to what a good Sharpe ratio is explains the benchmarks.
Worked example: a timing rule that died out of sample
We tested a simple, real rule on Damodaran’s annual data: hold the S&P 500 for the year if last year’s S&P 500 return was above a threshold, otherwise hold T-bills. We charged a 0.1% cost each time the rule switched. We tried thresholds from -30% to +30% in 5-point steps on 1929 to 2000, picked the best, then ran that exact rule on 2001 to 2025.
| Period | Strategy | Sharpe ratio | Annual growth | Worst annual drawdown |
|---|---|---|---|---|
| 1929 to 2000 (in-sample) | Buy and hold | 0.39 | 10.06% | -64.8% |
| 1929 to 2000 (in-sample) | Best rule (threshold -10%) | 0.44 | 10.32% | -42.9% |
| 2001 to 2025 (out-of-sample) | Buy and hold | 0.48 | 8.74% | -36.5% |
| 2001 to 2025 (out-of-sample) | Same rule, no changes | 0.41 | 7.06% | -36.5% |
In-sample, the rule looked like a win: higher Sharpe ratio, higher growth and a much smaller drawdown. Out of sample, it lost on both Sharpe ratio and growth and did not reduce the worst drawdown at all. Annual data is coarse and our drawdowns are measured on year-end values only, so treat this as a teaching example, not a verdict on market timing. The lesson holds anyway: the in-sample winner was partly picked for its luck.
Turnover makes the gap worse. The more often a strategy trades, the more spread, commission and slippage it pays, and the less of any edge survives. Our piece on paper trading slippage covers that gap in detail.
For tools: QuantConnect says it has 20 broker integrations and a community of 556,000 quants, researchers and engineers on its homepage. Backtrader is a popular free Python library with public documentation, but our report on Backtrader alternatives notes it has not shipped a release since 2023.
Why the out-of-sample test is so strict
Every time you look at out-of-sample results and then change the rule, that data stops being out-of-sample. Researchers Bailey, Borwein, López de Prado and Zhu built a whole framework, the Probability of Backtest Overfitting (Journal of Computational Finance, 2017), to estimate how likely the best in-sample strategy is to underperform out of sample. The practical takeaway is simple: count your trials, and open the vault once. Our coming guide to overfitting vs underfitting goes deeper.
Which Strategy Types Should a Beginner Quant Test First?
Start with strategy families that have a clear economic story and few parameters. Fewer knobs means less room to overfit, and a clear story gives you a reason to expect the pattern to continue.
Trend following. Buy what has been rising and step aside from what has been falling, usually with a moving average or a breakout rule. The story: trends persist because information spreads slowly and investors under-react. The weakness: choppy, sideways markets produce a string of small losses. Our timing-rule example is a crude member of this family.
Mean reversion. Buy short-term dips in liquid assets and sell after a bounce, usually with an oscillator such as RSI or a distance-from-average rule. The story: short-term overreactions fade. The weakness: a dip that keeps falling, so the stop and the position-size cap matter more here than anywhere.
Cross-sectional momentum. Rank a universe of stocks by past performance and hold the top group. The story is similar to trend following, applied across many names. The weakness: it needs a survivorship-free universe and pays more in turnover, so data quality and costs decide whether it works for you.
Calendar and event rules. Trade around earnings, index changes or month-end. These are easy to test and easy to overfit, because there are endless ways to slice the calendar. Write the event definition before you look at results.
Matching the strategy to your setup
| If you have | Start with | Why |
|---|---|---|
| A small account and a day job | Daily trend or mean-reversion rule on one liquid ETF | One signal a day, low turnover, easy to monitor |
| Python skills and free data | Trend rule across a handful of ETFs | Tests whether the idea works beyond one ticker |
| Paid, survivorship-free stock data | Cross-sectional momentum | Needs the full universe, including delisted names |
| No coding at all | A no-code backtester plus paper trading | Learn the process before learning the language |
Decision rule: pick one family, one universe and one timeframe. Run the full six stages on it before you try a second idea. A beginner testing five ideas at once is running a trial-count experiment on themselves.
How Can Claude Help You Write and Test a Quant Strategy?
AI coding assistants like Claude can speed up quantitative trading research by turning a plain-English rule into backtest code, explaining code back to you and catching bugs. Code that runs is not an edge, though, and an AI that can try a hundred variants in an hour can overfit faster than you can.
A realistic workflow:
- Describe the rule exactly. “Write a Python backtest that buys SPY when the 10-day SMA crosses above the 50-day SMA, with a 3% stop and 1% risk sizing, capped at 25% of equity.”
- Review the code line by line. Does the entry match? Is the stop calculated from the entry price? An off-by-one error in a lookback window can silently use tomorrow’s data.
- Ask for cost modeling explicitly. Many generated backtests default to zero commission and zero slippage. Specify both, then confirm every trade pays them.
- Sanity-check the output. A 95% win rate is not genius. It usually means look-ahead bias, where the code uses information from after the decision.
- Make it explain edge cases. “What happens on a day with no volume?” “What happens if the stop and target hit on the same bar?” If the answer surprises you, you found a bug.
- Make it log every variant it tries. That number is your trial count, and it decides how much you should trust the winner.
Two creator videos show this workflow in practice. Lewis Jackson Investing’s “I Re-Created A Quant Trading Strategy With Claude Code (Insanely Cool)” walks through rebuilding a strategy with Claude Code:
AI Pathways’ “How To Actually Use Claude Code for Trading Strategies (Like a Quant)” covers a similar process:
Watch them for the mechanics. Then apply the six checks above to anything you build, because neither a working script nor a nice equity curve is evidence of an edge.
How Do You Run the Strategy as a Paper Bot?
Running a quantitative trading strategy as a paper bot means connecting your tested rule to a simulated account that uses real-time prices and fake money, so you can prove the system works operationally before real cash is at risk.
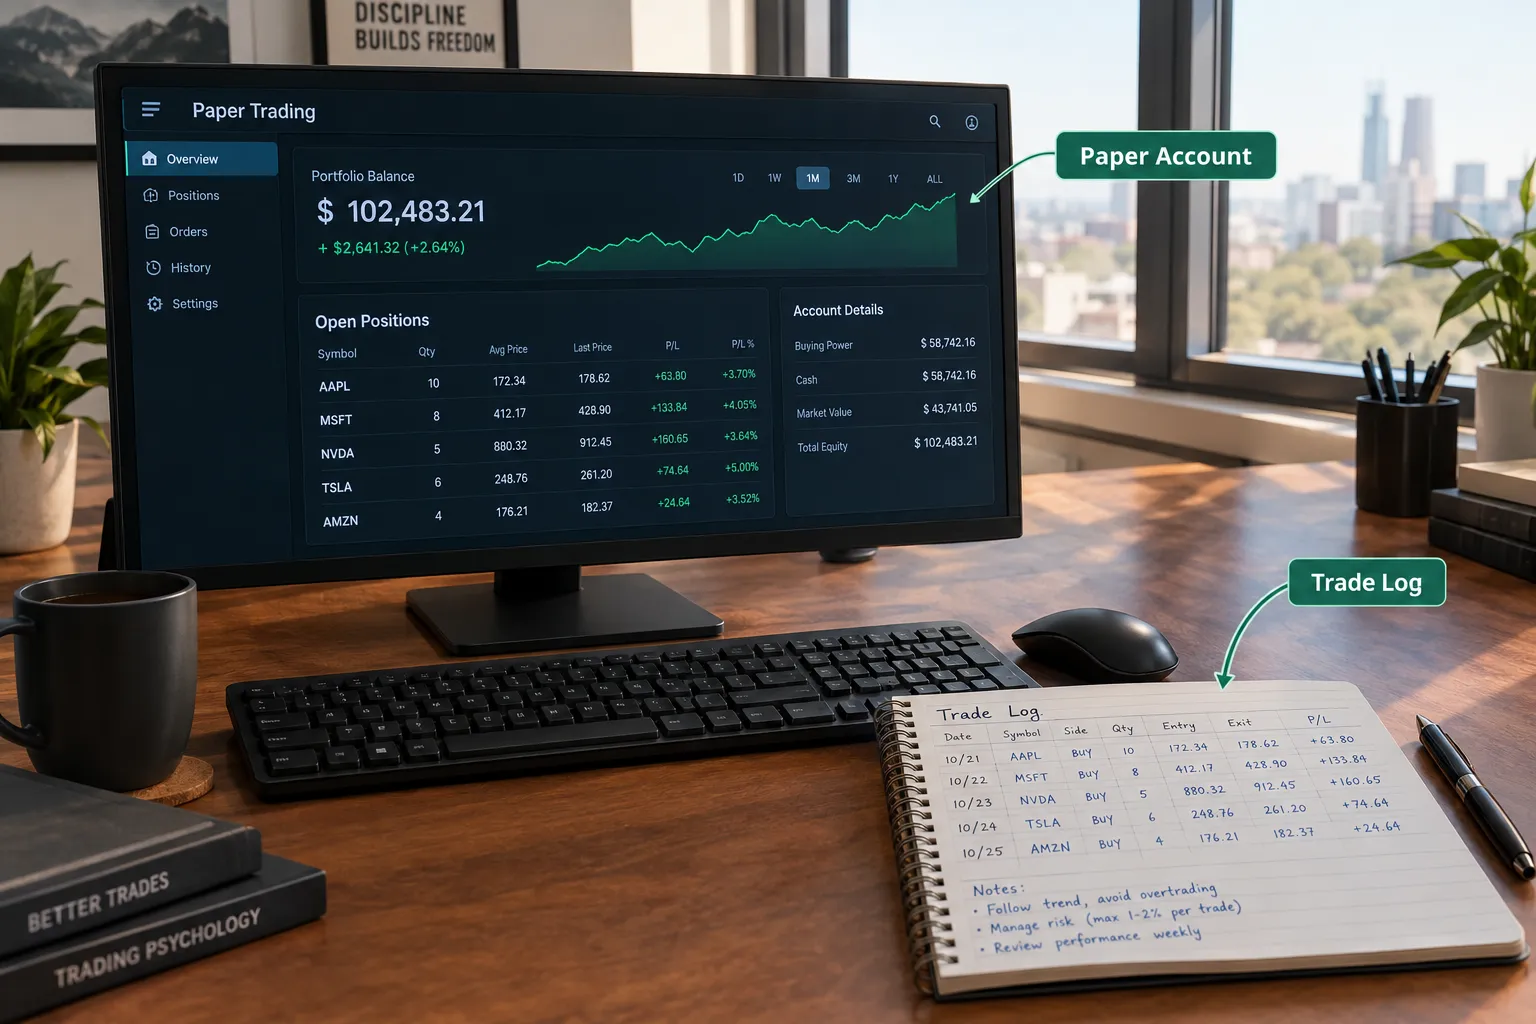
Open a paper account. Alpaca’s paper trading is free, starts with a $100,000 balance and uses the same API as live trading; for most libraries you point APCA_API_BASE_URL at https://paper-api.alpaca.markets. Alpaca now lets you create and delete paper accounts instead of resetting them. Our Alpaca API for beginners guide walks through keys and a first order. If you prefer an app with no code, our Webull paper trading walkthrough covers that route.
Start with alerts, not automation. A first bot can be a script that checks the rule once a day and alerts you to place the paper trade by hand. Full automation adds operational risk (crashed scripts, duplicate orders, time-zone bugs) you do not need on day one.
Keep a trade log. Every trade: entry, exit, size, the rule that fired and the data timestamp. The log is how you catch duplicate orders, missed fills and a script that silently stopped three days ago.
Run it for at least 30 days. Paper trading tests whether the system is operationally sound: it places orders correctly, handles holidays and reconciles positions after a restart. Three or four days proves almost nothing.
Know what paper trading does not prove. Alpaca’s own docs say its paper environment does not account for market impact, slippage from latency, queue position or regulatory fees, and does not simulate dividends. A strategy can paper trade beautifully and still lose money live because real fills are worse.
Worked example: adjusting paper results for costs
Say your paper bot made 40 round trips in a month on a $10,000 account, with an average position of $5,000, and showed a $150 gain. Before you celebrate, estimate what paper skipped. If you assume 0.05% slippage on each side of each trade:
- Slippage per round trip = $5,000 x 0.05% x 2 = $5
- For 40 round trips = $200
Your $150 paper gain becomes about a $50 loss once modest slippage is included, before any fees. Your real slippage could be lower or higher; measure it with small live orders later. The point is to run this math before going live, not after.
What Do Quantitative Traders Earn and Is It Realistic for Beginners?
Professional quants at hedge funds and prop firms can earn high pay, but that describes employees with institutional capital, data and execution, so it says little about what a beginner doing quantitative trading at home should expect. We do not quote salary figures here because published numbers vary widely by firm and role; check a named, current source such as a specific firm’s job posting.
What matters structurally:
- Scale. The same percentage edge produces far more dollars on institutional capital than in a $5,000 account.
- Costs. Institutions often pay less to trade than retail accounts, so the same strategy keeps more of its edge.
- Infrastructure. Clean data, fast execution and research teams are expensive and shared across many strategies.
That is not a reason to skip quantitative trading. It is a reason to set the goal correctly. The value for a beginner is not matching a hedge fund’s returns; it is replacing guesswork with a repeatable process you can measure. A beginner who builds one tested, honestly evaluated strategy is ahead of most traders who never test anything.
No one on this page promises a return, a salary or a win rate. Anyone who does is selling something other than a working system.
Why Do Most Quant Beginners Lose Money?
Most quant beginners lose money through four repeatable mistakes: overfitting to past data, ignoring real costs, trusting samples that are too small, and abandoning a process at the wrong time.
Overfitting. Test enough indicators, lookback windows and filters and something will look profitable by chance. The winner in-sample is often the one that got lucky, as our timing-rule example showed. The more knobs you turn, the more likely your best result is noise.
Ignoring costs. A strategy that looks good before commissions and slippage can lose after them, especially at higher trade frequency. The paper-bot example above turned a $150 gain into a $50 loss with a modest slippage assumption.
Small samples. Six months of data or a single stock tells you little. Markets move through regimes (trending, choppy, high volatility, low volatility), and a rule can work in one and fail in another. Demand a sample that spans several.
Quitting at the wrong time. Every sound strategy has losing streaks. Quitting a tested process after five losses and jumping to a new idea means nothing ever gets a fair test. The opposite mistake is refusing to kill a strategy that clearly failed its out-of-sample test because you are attached to it. Both come from letting emotion override the falsification rule you wrote at the start.
The fix for all four is the discipline repeated through this guide: write the rule, test it honestly, include real costs, demand enough data, and respect the kill condition you set before you saw the results. Systems over hacks. Process over prediction.
A 30-day starter plan
- Week 1: write one rule for one liquid ticker (SPY is fine), including its kill condition. Get data and check splits and dividends.
- Week 2: backtest it on the older part of your data with costs. Log every variant you try.
- Week 3: run the locked out-of-sample period once. If it fails, write down why and stop.
- Week 4: if it passes, start paper trading with alerts and a trade log, and plan for at least 30 more days before any live test.
Frequently Asked Questions
What is quantitative trading in simple words?
Quantitative trading means writing a trading rule as exact numbers, testing it on years of historical data with costs included, and trading it only if it holds up on data it never saw. It replaces gut feel with evidence. Most of the work is data cleaning, testing and code, not placing orders.
How do I start quantitative trading as a beginner?
Start with one simple rule on one liquid ticker, such as SPY, and write down what result would prove it wrong. Backtest it with costs, run a locked out-of-sample test once, then paper trade it for at least 30 days. Only then consider a small live test.
Do I need to code for quantitative trading?
Not at first, since no-code backtesters and paper accounts exist, but basic Python opens far more options. It lets you test custom rules, use free data and connect to broker APIs like Alpaca’s. AI assistants can help write the code, but you still need to read and check it.
What is the difference between quantitative and algorithmic trading?
Algorithmic trading only means a computer places the orders, and the rule can come from anywhere. Quantitative trading is a kind of algorithmic trading where the rule comes from a statistical test on data. A hunch that gets automated is algorithmic, not quantitative.
Why do backtests fail in live trading?
Usually because of overfitting, missing costs or small samples. In our example, a market-timing rule tuned on 1929 to 2000 data beat buy-and-hold in-sample, then lost to it from 2001 to 2025. Paper trading also skips slippage and market impact, so real fills are worse.
How much money do I need to start quantitative trading?
You can start with zero by paper trading; Alpaca’s paper account begins with $100,000 in simulated money. For a first live test, use a small amount you can afford to lose and risk around 1% of it per trade. Costs weigh more on small accounts, so favor low-turnover rules.
Can Claude write a quantitative trading strategy for me?
It can write and explain backtest code from a plain-English rule, which saves time. It cannot make the strategy profitable, and it may default to zero costs or introduce look-ahead bugs. Review every line, require cost modeling and have it log every variant it tries.
Our Take
Beginners should learn quantitative trading, not because it is easier or safer, but because the process forces honesty before it costs you money. Writing a rule, backtesting it with costs, locking an out-of-sample test and paper trading for a month exposes bad ideas cheaply instead of expensively. Our own timing-rule test shows how fast an in-sample winner can turn into an out-of-sample loser.
Start with one simple rule, one liquid ticker, a free paper account and a 30-day log. Do not touch real money until both the out-of-sample test and the paper run hold up. For more plain-English bot building and testing guides, start at AI Stock Trading Bots.
Once a strategy has survived a backtest, an out-of-sample test and a full paper cycle, send it to us and we will take a look.
Stay alpha.
The FullStack Alpha research desk tests AI trading bots on paper and live accounts. Reviewed and edited by Jay Rocco, Founder and Editor.
