

The FullStack Alpha research desk tests AI trading bots on paper and live accounts. Reviewed and edited by Jay Rocco, Founder and Editor.
By FullStack Alpha Editorial Team | Reviewed by Jay Rocco, Chief Editor
Overfitting vs underfitting is the two-sided failure behind most trading bots that look brilliant in a backtest and lose money live. Overfitting means the strategy memorized noise in its historical data; underfitting means it is too simple to capture any real pattern. The fastest check is to lock away an out-of-sample period and compare: a big gap between in-sample and out-of-sample results points to overfitting, while weak results on both points to underfitting. The math is unforgiving: Bailey, Borwein, López de Prado and Zhu showed that with only five years of data, trying more than 45 independent strategy configurations almost guarantees an in-sample Sharpe ratio of 1.0 from a strategy whose expected out-of-sample Sharpe ratio is zero.
Key insights
- Overfitting shows up as a large in-sample vs out-of-sample gap; underfitting shows up as flat, weak results everywhere.
- In “Pseudo-Mathematics and Financial Charlatanism” (Notices of the AMS, 2014), the authors note that with a two-year backtest, just 7 independent configurations are enough to expect an in-sample Sharpe ratio of 1.0 with zero real skill.
- In our simulation, the best of 174 moving-average settings on random-walk data averaged an in-sample Sharpe ratio of 0.70 and an out-of-sample Sharpe ratio of 0.06.
- A backtest that does not report how many variants were tried “makes it impossible to assess the risk of overfitting,” per the same paper.
- Decision rule: freeze the rules, test on data the model never saw, count the trades and count the trials before you trust any result.
What Is the Difference Between Overfitting and Underfitting?
Overfitting vs underfitting comes down to one question: did your strategy learn the market’s real behavior, or the specific noise in your dataset? Overfitting means the model is too complex for the data, so it fits every random wiggle. Underfitting means it is too rigid, so it misses the signal entirely.
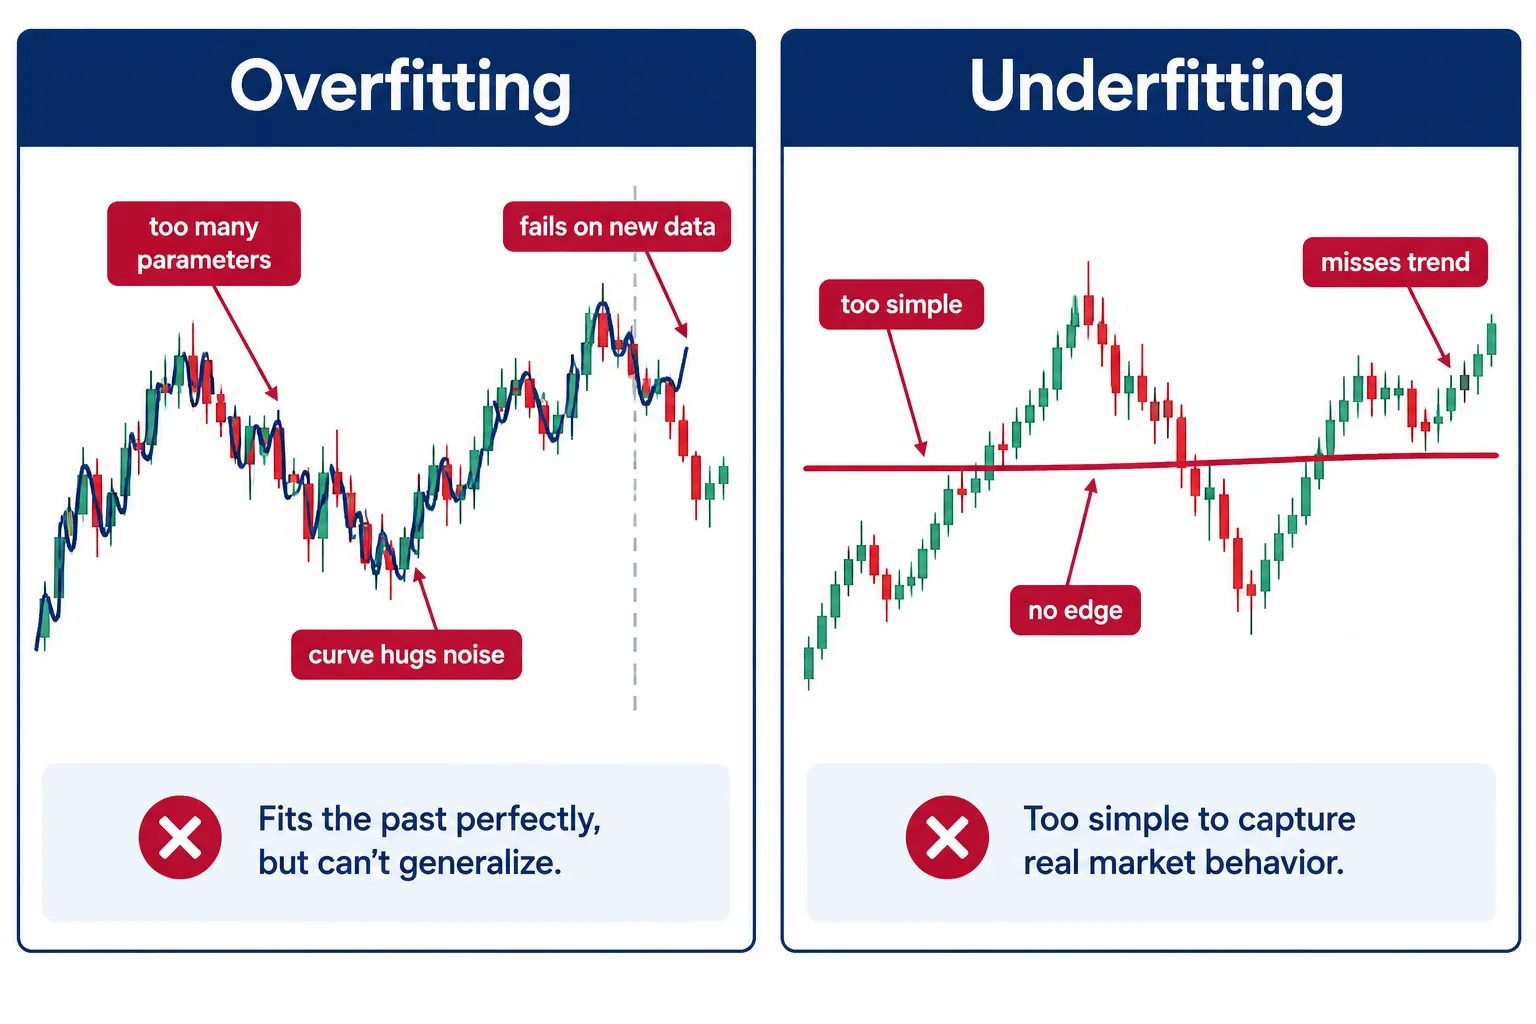
In trading terms: an overfit bot adds a moving average here, a volatility filter there and a special rule for Fridays until the backtest curve climbs like a staircase, because it was shaped to match what already happened. An underfit bot uses one crude rule, such as “buy when price crosses the 200-day average,” with no adjustment for volatility, volume or regime, so it misses opportunities that really exist.
Both are failures of generalization, the ability to work on data the strategy has not seen. A backtest that only works on the past is a history lesson. A trading plan has to survive the future.
Overfitting vs Underfitting in Trading Terms
| Sign | Cause | Fix |
|---|---|---|
| Backtest looks flawless, live results collapse | Too many parameters tuned to one historical window (overfitting) | Cut parameters; require a stable plateau of good results, not one sharp peak |
| Strategy barely beats a coin flip anywhere | Rule is too rigid or ignores key variables (underfitting) | Add one relevant factor at a time and test each addition separately |
| Win rate swings wildly month to month | Rules fit to specific past events | Walk-forward test across several distinct market regimes |
| No trades for months, then a cluster | Thresholds set by eyeballing a chart | Base thresholds on the distribution of the data, not visual matching |
| Sharpe ratio looks amazing, trade count is tiny | A handful of lucky trades inflating a small sample | Set a minimum trade count before trusting any ratio |
The practical rule: if your strategy needs a paragraph of exceptions to explain why it works, it is probably overfit. If it is one flat rule applied everywhere with no thought about conditions, it may be underfit.
The bias-variance picture, in one paragraph
Statisticians describe overfitting vs underfitting as a trade-off between bias and variance. A model that is too simple has high bias: it is consistently wrong in the same way. A model that is too complex has high variance: it changes a lot when you change the data, because it is fitting noise. The sweet spot sits between them, and in trading it sits closer to simple than most people expect, because market data is noisy and history is short.
What Does Overfitting Look Like in a Trading Bot Backtest?
On the overfitting side of overfitting vs underfitting, a trading bot backtest shows three repeatable patterns: too many tunable parameters, a suspiciously smooth equity curve, and performance that disappears the moment new data arrives.
Pattern one: parameter bloat. Every added input (a second moving average, an RSI filter, a volume threshold, a day-of-week rule) gives the optimizer another knob. More knobs means more configurations, and more configurations means a better-looking winner by luck alone. The authors of the 2014 paper put it directly: more complex strategies allow more configurations to be tried, and the risk of overfitting grows with every trial.
Pattern two: the too-perfect curve. Real edges have drawdowns, flat stretches and losing streaks. An equity curve that rises with barely a dip is usually a sign the strategy was shaped around the exact sequence of past prices.
Pattern three: the vanishing act. The bot goes live, and within days the returns look nothing like the backtest. Traders blame “changing conditions.” Often the real explanation is that there was never an edge, only a fingerprint of one dataset.
Worked example: optimizing on pure noise
To show how easily this happens, we ran a simulation. We generated 200 separate eight-year price histories as random walks with a tiny upward drift: by construction, no moving-average rule can have a real edge. On each history we tested 174 moving-average crossover settings (fast average 5 to 50 days, slow average 20 to 200 days), long when fast is above slow and short otherwise, with a 0.05% cost per position change.
We picked the best setting on the first five years (in-sample), then ran that same setting on the last three years (out-of-sample):
| Measure | Result |
|---|---|
| Average in-sample Sharpe ratio of the best setting | 0.70 |
| Average out-of-sample Sharpe ratio of that same setting | 0.06 |
| Average out-of-sample Sharpe ratio across all 174 settings | 0.03 |
| Share of histories where the best in-sample Sharpe ratio topped 1.0 | 22% |
Read the last row again. On data with no edge at all, more than one history in five produced a “winning” setting with an in-sample Sharpe ratio above 1.0. Out of sample, the winner was barely better than average. That is overfitting vs underfitting in one table: the optimizer found a story, not a signal.
The moving-average settings here are highly correlated with each other, so 174 settings behave like far fewer independent trials. That is why this is milder than the paper’s 45-trial result. Independent ideas (different indicators, different markets, different exits) overfit faster.
If you are evaluating a vendor’s bot, run three checks before funding anything: compare the parameter count with the data length, look for real drawdowns in the backtest, and ask how many variations were tried before this one was published. A vendor who cannot answer the last question did not track it, and that is its own answer.
What Does Underfitting Look Like in a Trading Bot?
On the underfitting side of overfitting vs underfitting, the picture is flat, mediocre or inconsistent results on every dataset: training, test and live are all the same disappointing mush. There is no spike to chase and no collapse to explain. The strategy never had enough structure to capture a real pattern.
A common example is a plain moving-average crossover with no volatility adjustment, no position sizing logic and no awareness of trending versus choppy markets. It treats a quiet summer the same as an earnings-season gap, because it was never built to tell the difference.
Signs of underfitting:
- Performance is about the same, and about as bad, on training data and new data.
- The strategy does not change behavior across market regimes.
- Win rate and risk-reward both sit near breakeven, with no edge in either.
- Adding one reasonable factor, such as a volume filter, clearly improves results on both in-sample and out-of-sample data, which suggests the original model ignored useful information.
Underfitting gets less attention because it is undramatic. But a strategy that never finds an edge is as useless as one that finds a fake one, and it wastes as much time getting there. Systems over hacks does not mean “the simplest rule wins.” It means the rule should match the real complexity of what you are trying to capture, and no more.
How Do Curve Fitting and Survivorship Bias Fool Backtests?
Curve fitting and survivorship bias are separate traps that sit alongside overfitting vs underfitting, and both make a backtest look better than reality. Curve fitting tunes the rules to past price moves. Survivorship bias quietly removes the failures from the sample before testing even starts.
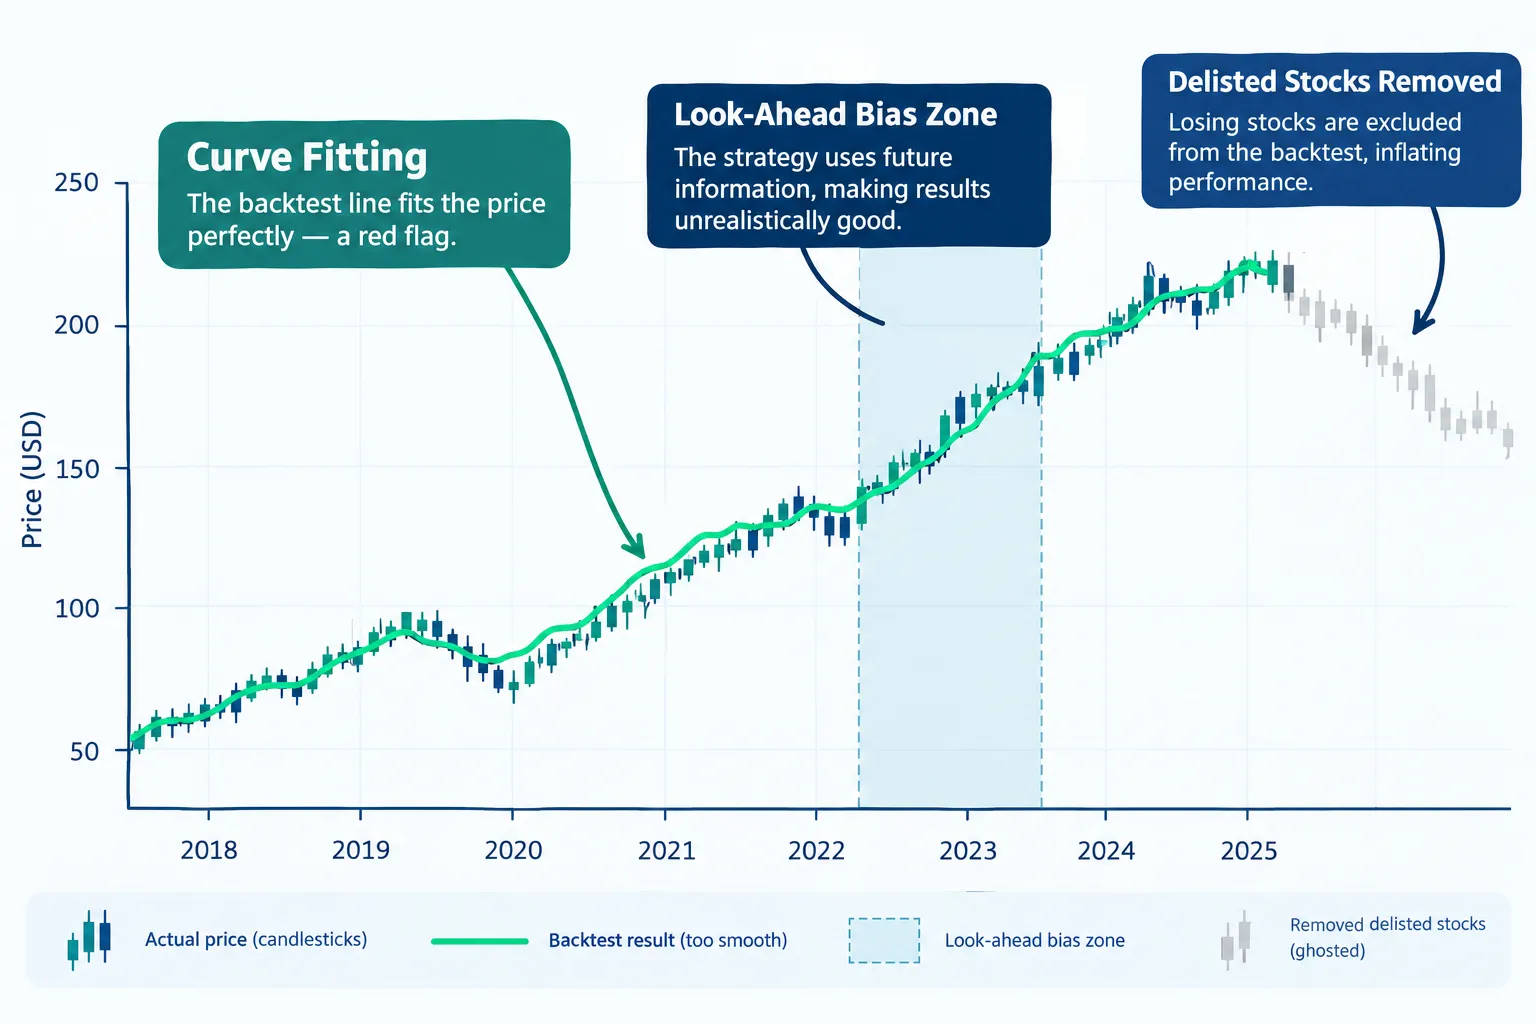
Curve fitting, often called data snooping, happens when you adjust entry rules, stops or indicator settings until the backtest looks strong, then stop and call it a strategy. Say you test a breakout system on a stock that had a monster run one year and tweak the threshold until it catches every leg. You have built a system that describes one stock’s one good year. You have not built a system that predicts breakouts.
Survivorship bias happens when your backtest universe includes only stocks that still trade today. Every company that was delisted, went bankrupt or was acquired at a loss is missing, so the average return looks better than what traders actually experienced. It matters most for small caps, where delistings are common and many free data sets drop dead tickers.
Look-ahead bias is the third cousin: the backtest uses information that was not available at trade time, such as using the day’s closing price to trigger an intraday entry, or revised earnings before the revision existed. It is easy to introduce by accident and hard to spot unless you check data timestamps against trade timestamps. Our look-ahead bias guide shows how AI-written backtests leak future data and how to audit them.
The 2014 paper adds a warning that surprises most traders: when data has memory (mean reversion or autocorrelation), more in-sample optimization can make out-of-sample results worse, not just less good. The authors found a statistically significant negative relationship between in-sample and out-of-sample Sharpe ratios in that setting. In plain words, the harder you tune, the more you lose.
Market truth: a backtest is only as honest as its data and process. Curve fitting corrupts the rules. Survivorship bias corrupts the sample. Either alone can turn a mediocre idea into a fake winner.
How Do You Tell Overfitting From Underfitting?
You tell overfitting vs underfitting apart by comparing three things: the gap between training and test results, behavior in walk-forward testing, and the number of trades and trials behind the numbers.
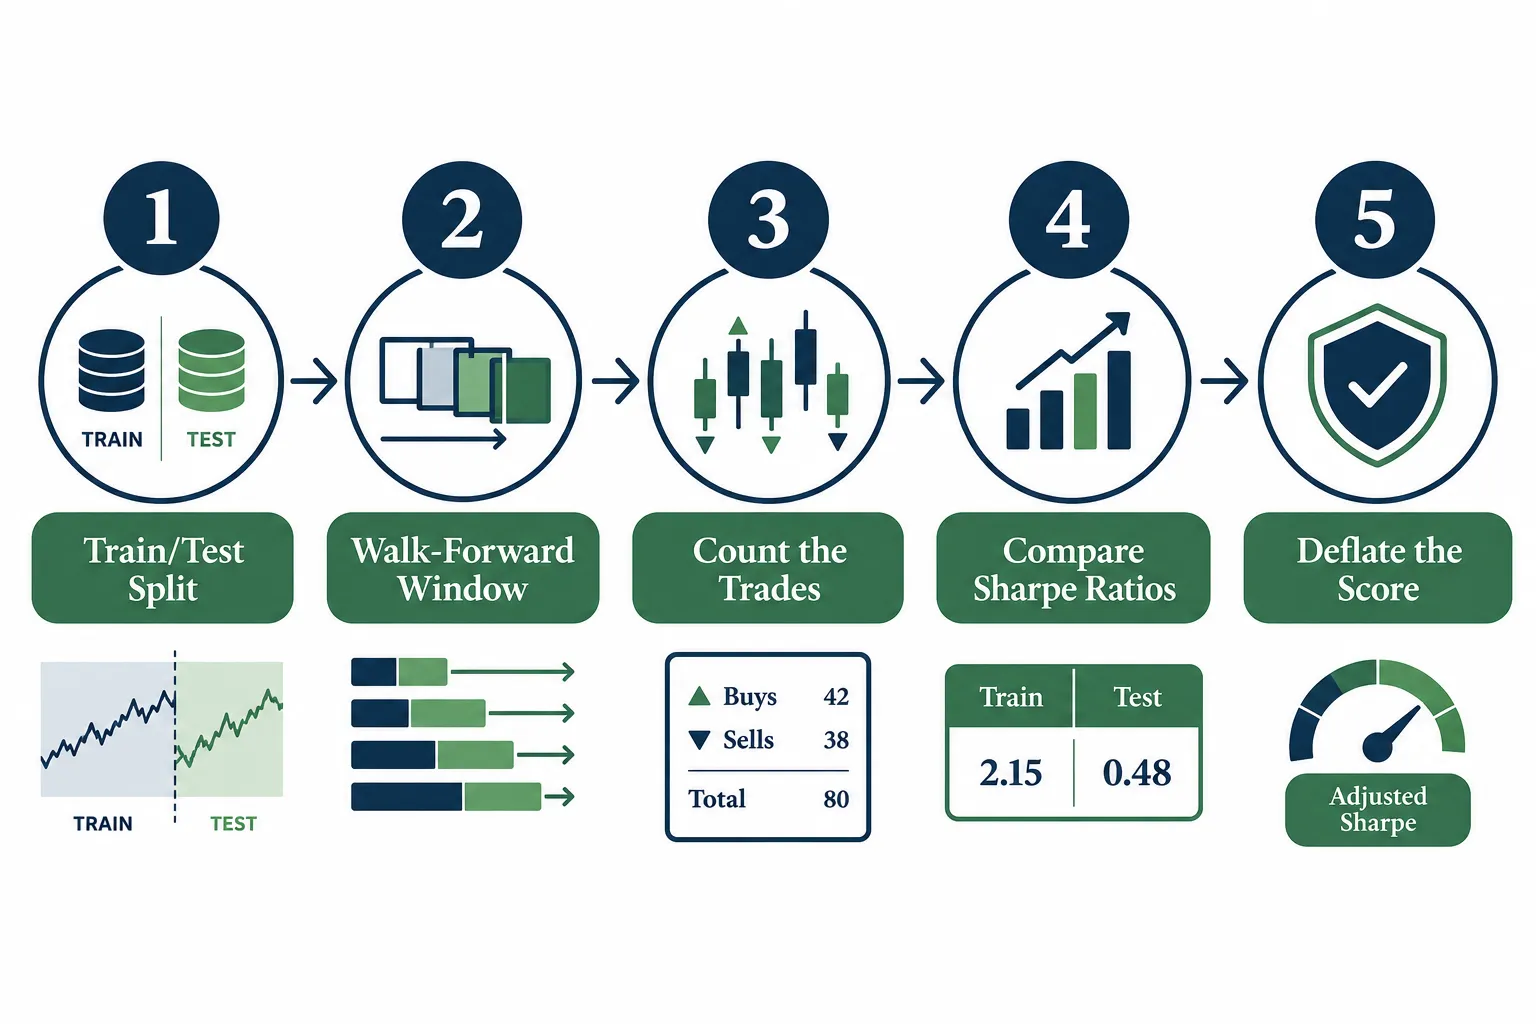
- Split your data honestly. Set aside a block of history the model never touches during development. If you built the strategy on all your data, you have a description of the past, not a backtest.
- Compare in-sample and out-of-sample results. A small gap suggests the strategy generalizes. A large gap points to overfitting. Weak results on both point to underfitting.
- Walk forward. Re-optimize on a rolling window and test on the next unseen period, repeatedly, moving through time. This mimics how you would actually rebuild and redeploy the strategy.
- Count the trades. A strategy with 20 trades and a dazzling Sharpe ratio is noise in a suit. Hundreds of trades across several regimes carry more weight, even if the ratio looks less exciting.
- Look for a plateau, not a peak. If results are good only at one exact setting and fall apart one step either side, that is a classic overfitting fingerprint. If a broad range of nearby settings all work reasonably, that is a plateau, and plateaus generalize better.
- Deflate the score. Adjust your Sharpe ratio for the number of variations you tested. A 1.5 after testing three ideas means something very different from a 1.5 after testing 300. Our guide to what a good Sharpe ratio is walks through the Deflated Sharpe Ratio and a luck simulation.
How long does a backtest need to be?
The 2014 paper gives a rule called the Minimum Backtest Length: the more independent configurations you try, the more years of data you need before an in-sample Sharpe ratio of 1.0 means anything. Its two anchor points:
- 2 years of data: about 7 independent configurations are enough to expect an in-sample Sharpe ratio of 1.0 from a skill-less strategy.
- 5 years of data: about 45 independent configurations do the same.
So if you tested 100 independent ideas on five years of data, an in-sample Sharpe ratio of 1.0 is roughly what luck alone delivers. Either get more data, test fewer ideas, or demand a much higher in-sample number before you take a strategy forward.
Does walk-forward testing actually prevent overfitting?
Walk-forward testing reduces the risk but does not remove it. If you keep redesigning the strategy every time you peek at a new out-of-sample window, you are overfitting one window at a time instead of all at once.
Three habits make it work:
- Leave a gap between training and test data. Rolling indicators and lagged features can leak information across the boundary. scikit-learn’s TimeSeriesSplit has a
gapparameter that drops samples just before each test block for exactly this reason, and it never trains on future data to test on the past. - Count every walk-forward redesign as a trial. Each time you change the rules after seeing results, add one to your trial count.
- Keep a final vault. Hold back the most recent stretch of data and open it once, after everything else is frozen. If the strategy fails there, it fails.
How Does Overfitting vs Underfitting Apply to AI and Machine Learning Bots?
Overfitting vs underfitting matters even more for machine learning and AI-built bots, because these models have far more knobs than a hand-written rule, and AI coding assistants can try thousands of variations in an afternoon.
Three things change when a model, not a person, writes the strategy:
- The trial count explodes. An AI assistant asked to “improve the Sharpe ratio” will happily test hundreds of tweaks. Every one counts toward the trial count that the Minimum Backtest Length depends on. Ask it to log every variant, and count them.
- Leakage gets subtle. Machine learning features built from rolling windows, normalized prices or future-adjusted data can leak information across the train-test boundary. Use time-ordered splits only, with a gap, as in scikit-learn’s TimeSeriesSplit. Never use a random shuffle on market data.
- Language models already know the history. A model asked to judge whether a stock was a good buy in a past year may already know what happened next. The open-source ai-hedge-fund project fixed exactly this in 2026 by withholding tickers, industries and dates from its LLM prompts, after finding backtests were scoring the model’s memory of companies.
A practical guardrail for AI-written strategies: before the AI touches your data, write down the hypothesis, the parameters it may change, the maximum number of variants it may try and the final holdout period it may never see. Then hand it the training data only. If the strategy still works on the holdout after all that, you have something worth paper trading.
Underfitting in machine learning bots
ML bots underfit too. A classifier that predicts “up” every day in a rising market can show 55% accuracy with zero skill. Compare every model against a dumb baseline (buy-and-hold, or “always predict the most common outcome”) on the same out-of-sample period. If it does not beat the baseline after costs, it is underfit or it has no edge, and more features will usually push it into overfitting instead of fixing it.
Is 98 Percent Accuracy Overfitting?
A trading model reporting 98% accuracy is almost always a red flag for overfitting, a leak, or a meaningless target. Accuracy is the wrong metric for trading, because it counts how often the direction was right without weighing win size, loss size, costs or how many predictions were tested.
A model can hit 98% by predicting tiny, meaningless moves correctly while missing the few large moves that decide profit and loss. You can be right 98% of the time and still lose money if your one wrong call is a big loss.
Worked example: high accuracy, negative money
Say a model makes 100 calls. It is right on 98 and wins $10 on each, then wrong on 2 and loses $600 on each because the stop was skipped.
- Wins: 98 x $10 = $980
- Losses: 2 x $600 = $1,200
- Net: -$220, before fees
High accuracy, negative expectancy. Very high accuracy on noisy market data also often means the model saw the answer in its inputs (look-ahead) or was tested on too few samples.
What actually matters instead:
- Risk-reward: average win versus average loss, not just how often you win.
- A deflated Sharpe ratio that accounts for the number of trials.
- Drawdown: the worst peak-to-trough loss and whether you could hold through it.
- Trade count: small samples make any metric look heroic.
Decision rule: if a vendor or backtest leads with an accuracy percentage instead of risk-adjusted return, trade count and drawdown, assume overfitting until proven otherwise.
How Do You Fix Overfitting in a Trading Strategy?
You fix the overfitting half of overfitting vs underfitting by cutting complexity, testing on data the model has never seen, and judging results after costs and across regimes rather than by the smoothness of the curve. There is no single trick. It is a checklist you run every time.
The overfitting fix checklist:
- Cut parameters to the minimum that makes economic sense. If you cannot explain in one sentence why a rule should work (not what it does to the backtest), remove it.
- Reserve true out-of-sample data and never touch it during development. If you peek and adjust, it becomes in-sample data in disguise.
- Walk forward across distinct regimes, not just one bull run or one calm stretch.
- Favor simple rules early. A clean breakout-from-consolidation rule has fewer moving parts to overfit than a ten-indicator stack.
- Include realistic costs (spread, slippage, commissions) in every test. Our piece on paper trading slippage shows how much friction simulations hide.
- Look for a plateau of good nearby settings instead of chasing the single best one.
- Log every variation you test. The 2014 paper is blunt: without the number of trials, the risk of overfitting cannot be assessed.
- Paper trade on a fresh stretch of time before risking capital.
None of this guarantees profit. Discipline beats prediction, and the goal is a model honest enough to tell you its own limits. For asset-specific pitfalls, see our options backtesting guide and our futures backtesting software breakdown.
Fixing underfitting without tipping into overfitting
Underfitting has the opposite fix, and it is where people overshoot. Add one factor at a time, with a reason you can state before you test it. Keep it only if it improves both in-sample and out-of-sample results, and add one to your trial count every time. If adding a factor helps in-sample but hurts out-of-sample, you just crossed from underfitting to overfitting. Take it back out.
How Do You Test a Bot for Overfitting Before Going Live?
You test a bot for overfitting vs underfitting before going live by paper trading it with frozen rules, a minimum trade count and a stop rule decided in advance. This is the last gate between “looks good on screen” and real money.
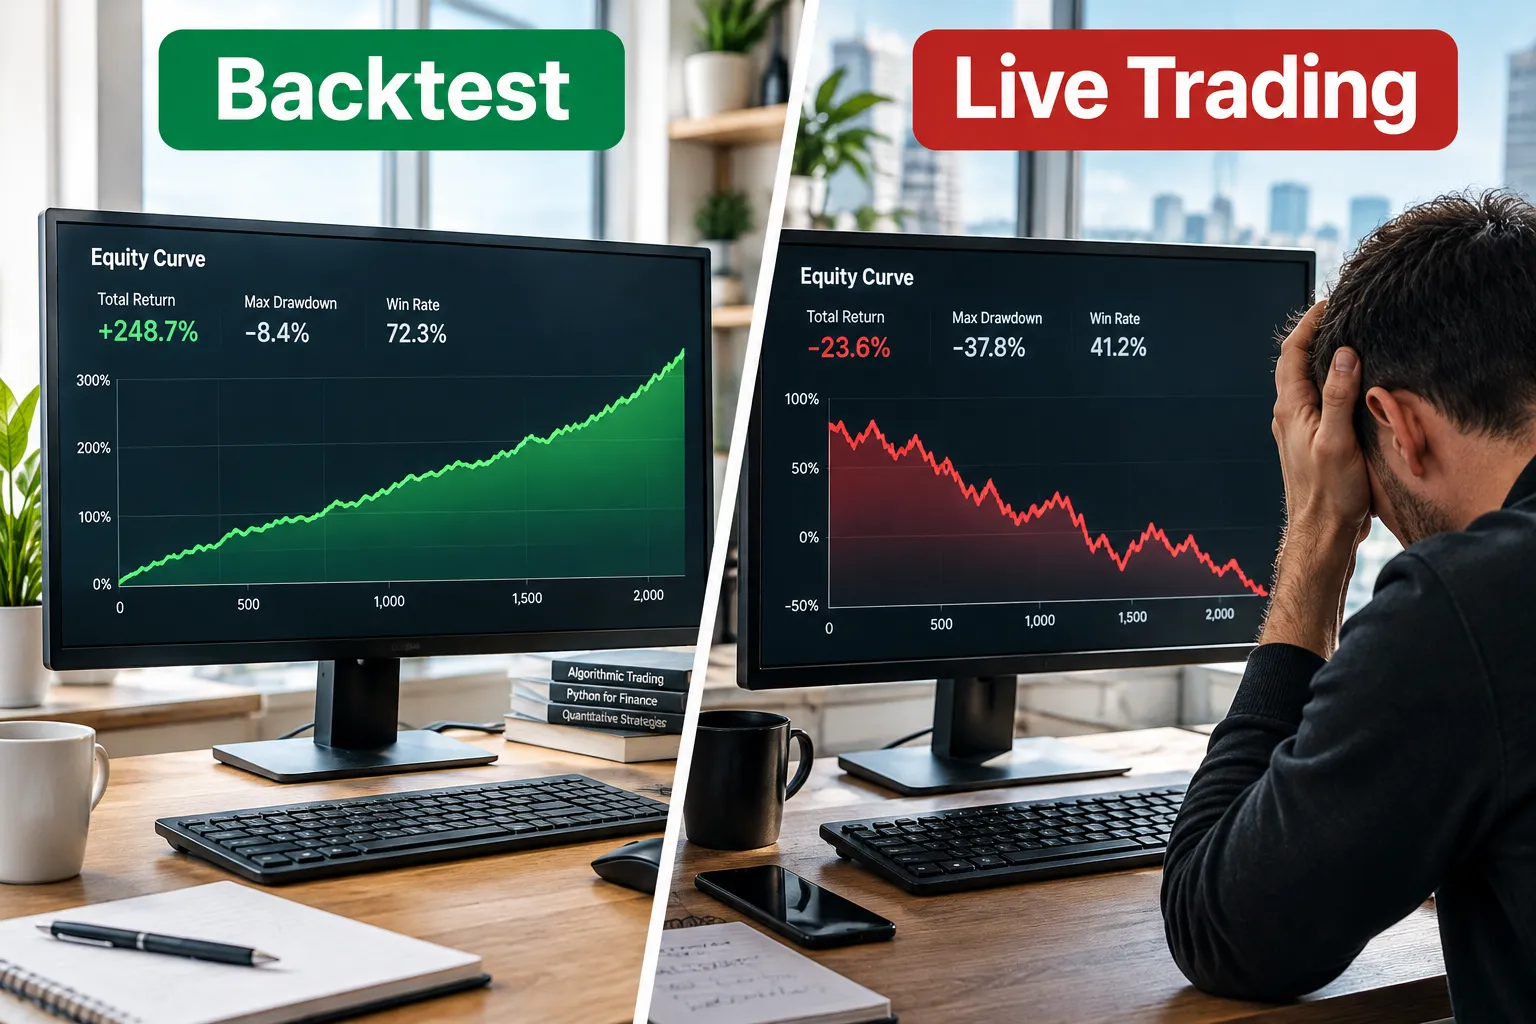
A paper-test plan:
- Freeze the rules. No tuning once paper testing starts, or you are overfitting the paper test.
- Set a minimum trade count before judging anything, enough to span more than one kind of market.
- Track the same metrics as the backtest: risk-reward, drawdown, win rate, Sharpe ratio, trade count.
- Write a stop rule now. For example: if the paper Sharpe ratio after 100 trades is less than half the backtest’s, or the drawdown exceeds the backtest’s worst by 50%, the strategy fails.
- Scale in slowly if paper results hold. Start small; position size is your protection against overfitting you have not found yet.
Worked example: is the live gap normal or a red flag?
Your backtest showed a Sharpe ratio of 1.4 over five years. After one year of paper trading, the paper Sharpe ratio is 0.6. Is that overfitting?
Not necessarily, on one year alone. A Sharpe estimate from one year of data is very noisy; in our separate simulation of a strategy with a true Sharpe ratio of 1.0, one year of results had a spread (standard deviation) of about 1.0. A 0.6 sits well inside that noise. What it does mean is that you cannot confirm the edge yet. Keep paper trading, keep the rules frozen, and look at trade count and drawdown alongside the ratio. If the gap persists over two or three years, treat it as overfitting.
If a bot keeps failing this test, it is rarely bad luck. Compare tools that make honest testing easier in our best free backtesting software guide, and if you build in TradingView, the TradingView tool profile on our directory covers its testing features.
Frequently Asked Questions
What is the difference between overfitting and underfitting?
Overfitting vs underfitting is the difference between a strategy that memorized noise and one that is too simple to find a pattern. An overfit strategy looks great in the backtest and fails on new data. An underfit strategy looks weak everywhere, in and out of sample.
How can you tell if a trading strategy is overfit?
Compare in-sample results with a locked out-of-sample period. A large gap points to overfitting, especially if results only look good at one exact parameter setting. Also count how many variations you tried, because more trials make a lucky winner more likely.
How many strategy variations can I test before overfitting?
Fewer than most people think. Bailey, Borwein, Lopez de Prado and Zhu showed that with five years of data, more than about 45 independent configurations almost guarantees an in-sample Sharpe ratio of 1.0 with zero real skill. With two years of data, about 7 is enough.
Is 98 percent accuracy overfitting?
Almost always it signals overfitting, data leakage or a meaningless target. Accuracy ignores the size of wins and losses, so a model can be right 98 times out of 100 and still lose money if its two losses are large. Judge trading models on risk-adjusted return, drawdown and trade count.
Does walk-forward testing prevent overfitting?
It reduces the risk but does not remove it. If you redesign the strategy every time you see a new out-of-sample window, you are still overfitting, one window at a time. Leave a gap between train and test data, count every redesign as a trial and keep a final holdout untouched.
What is curve fitting in trading?
Curve fitting, also called data snooping, is adjusting a strategy’s rules until they match past price action closely. It produces backtests that describe the past well and predict the future poorly. It is the most common route to overfitting in retail trading bots.
How do I fix underfitting without overfitting?
Add one factor at a time, with a reason stated before you test it, and keep it only if it improves both in-sample and out-of-sample results. Count each addition as a trial. If a factor helps in-sample but hurts out-of-sample, remove it.
Our Take
Overfitting vs underfitting is not a technical footnote. It is the main reason retail trading bots die within months of going live, and it is rarely discussed because “my backtest looked incredible” sounds better than “I fit my model to noise.” The research is clear: with five years of data, 45 independent tries is enough to manufacture a Sharpe ratio of 1.0 out of nothing.
Simple rules, honest out-of-sample tests, a written trial count and fresh data beat a perfect curve every time. If you are building or buying a bot, assume it is overfit until it proves otherwise on data it has never seen. That is not pessimism. That is process over prediction. Write down your trial count, keep a vault of untouched data, and let the boring numbers (trade count, drawdown, out-of-sample Sharpe ratio) make the decision instead of the prettiest chart on your screen. For more plain-English bot testing guides, start at AI Stock Trading Bots.
Related: when a strategy finally survives these tests, the broker and platform reviews at AI Stock Picker App help you pick where to run it with real fills and real costs.
Have a bot you think gets this right, or one you are skeptical of? Send it to us and we will review it.
Stay alpha.
The FullStack Alpha research desk tests AI trading bots on paper and live accounts. Reviewed and edited by Jay Rocco, Founder and Editor.
