

A gamma exposure chart shows where options dealer hedging is most likely to pin price or accelerate it, and if you already hold a Schwab account you can build one for free instead of renting one.
Quick Answer
A gamma exposure chart plots estimated dollar gamma per strike, with calls counted positive and puts negative, so you can see the Call Wall, the Put Wall and the zero gamma flip level. The math is simple: gamma x open interest x 100 x spot price squared x 0.01, which is the per-1%-move formulation described in the SqueezeMetrics white paper. The Schwab Trader API hands account holders option chains with Greeks and open interest at no separate fee, which is why a self-built gamma exposure dashboard has become a realistic alternative to a paid GEX subscription. The catch: open interest updates once per day, and dealer positioning is modeled, not observed.
Key Takeaways
- The formula is public. Net GEX per strike = gamma x open interest x 100 x spot squared x 0.01, the dollar-gamma convention published by SqueezeMetrics.
- Schwab data is included. Option chains with Greeks sit inside the Schwab market data API alongside quotes, historical prices and instruments.
- Tokens expire fast. Community Python tooling reports roughly 30-minute access tokens and about 7-day refresh tokens, per the schwabpy reference.
- Rate limits are fuzzy. One 2026 guide treats 120 requests per minute as the practical market-data ceiling with backoff on HTTP 429, per Schwabdev’s market-data notes.
- Prebuilt code exists. GitHub’s gamma-exposure topic lists EzOptions-Schwab, a Flask and Plotly dashboard with GEX, DEX, vanna, charm and 0DTE SPX views, plus other actively updated Python projects.
- Free does not mean better. Paid desks like SpotGamma, MenthorQ and Unusual Whales ship clean levels today. You ship them after a weekend of debugging.
What does a gamma exposure chart show?
A gamma exposure chart shows the estimated dollar value of options market-maker hedging obligations at each strike, so traders can see which price levels act like magnets and which act like trapdoors. Positive total gamma exposure is conventionally linked to dealers buying weakness and selling strength. Negative GEX flips that into procyclical hedging that can amplify the move.
Gamma is the Greek that measures how fast delta changes when price moves. Delta tells you how many shares a dealer must hold. Gamma tells you how violently that share count changes.
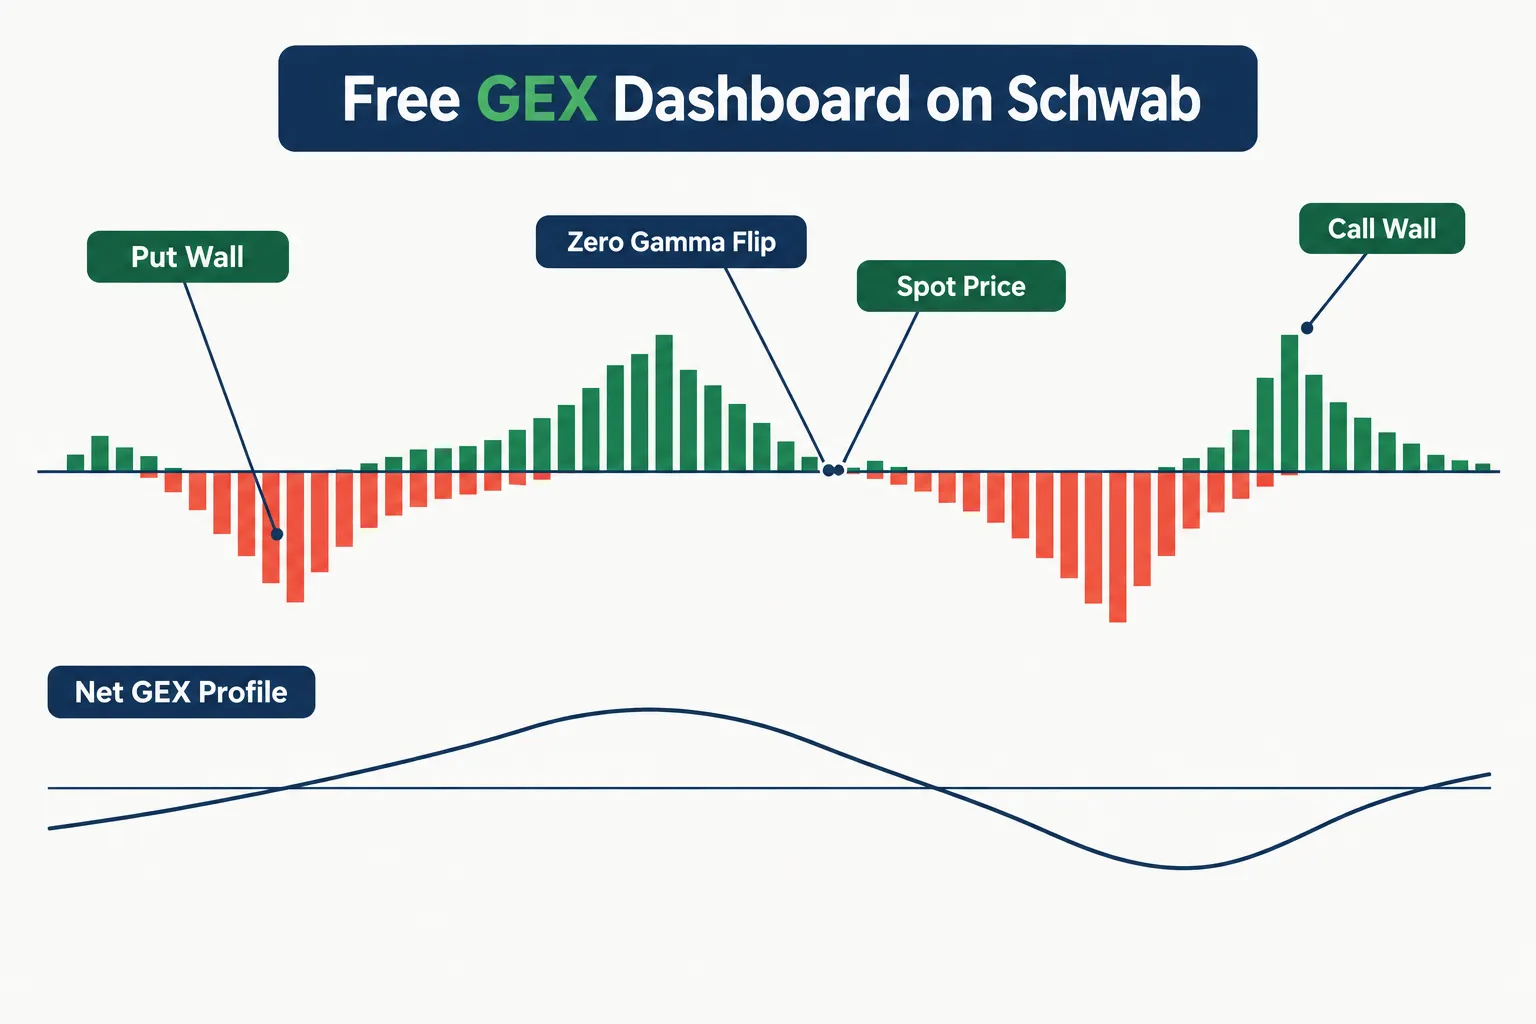
Key components of a gamma exposure chart
- Call Wall: the strike with the largest positive gamma, often behaving like resistance.
- Put Wall: the largest negative gamma strike, often behaving like support.
- Zero gamma flip: where net gamma crosses zero. Above it, suppressed ranges. Below it, faster tape.
- Strike profile: gamma values per strike, the core bar histogram.
- Open interest analysis: the OI strike profile behind the gamma, since gamma without contracts is noise.
Gamma exposure is not Value at Risk. A VaR number estimates your portfolio loss. Gamma exposure estimates somebody else’s hedging flow, which is far more useful for picking entries.
Gamma exposure chart: how to read one without fooling yourself
Read a gamma exposure chart from the zero line outward: tall green bars above zero mark likely resistance shelves, deep red bars below zero mark likely support, and the flip level tells you which regime you are trading in today. Levels, not predictions.
The panels worth building
| Panel | What it answers | Who leans on it |
|---|---|---|
| Strike profile | Where is gamma concentrated now | Day traders |
| GEX heatmap by expiration | Which expiry owns the level | Swing traders |
| Gamma exposure by expiry | Is the wall 0DTE or monthly | Both |
| Gamma price profile | How exposure shifts across spot | Both |
| Volatility skew | Are puts bid relative to calls | Options sellers |
| OI strike profile | Is the gamma backed by real contracts | Both |
| Intraday delta GEX | What changed since the open | 0DTE traders |
| Signals | Flip crossings, wall breaks | Systems traders |
Day traders versus swing traders
Day traders care about intraday delta GEX and 0DTE SPX concentration, since same-day flows dominate. Swing traders care about the monthly expiry walls, because those levels persist for weeks. A reasonable cadence: check the chart once pre-market, once at 10:00, once in power hour. Watching every tick is overtrading dressed up as analysis.
Market hours versus after hours
After hours, your gamma exposure chart is a snapshot, not a live read. Open interest is a daily number, so the overnight chart reflects yesterday’s positioning with a stale spot price. Rebuild it after the first exchange OI file lands, then again mid-session using live quotes.
Trading strategies built on these levels are usually boring: fade into the Call Wall, buy support at the Put Wall, stand aside near the flip. Boring is the point.
How do you calculate gamma exposure from an options chain?
Per-strike gamma exposure equals gamma x open interest x 100 x spot price squared x 0.01, with calls positive and puts negative under the standard dealer-positioning assumption. Sum every strike and you get net GEX plus the zero-gamma flip level. That exact implementation is documented in the open-source BitraAI gex_app project.
Here are the inputs, all of which come straight off the option chain:
| Input | Where it comes from | Example value |
|---|---|---|
| Gamma | Greek field on each contract | 0.0120 |
| Open interest | Contracts open at that strike | 4,000 |
| Contract multiplier | Fixed for standard US equity options | 100 |
| Spot price | Underlying quote, squared | 600 |
| Move size | Scales the result to a 1% move | 0.01 |
A worked example makes the math obvious. A call strike with 0.0120 gamma, 4,000 contracts open, spot at 600: 0.0120 x 4,000 x 100 x 600 x 600 x 0.01 equals about $17.3 million of dollar gamma for a 1% move. Repeat for every strike, flip the sign on puts, and add them up. That running total is what your gamma exposure chart plots.
Two implementation notes that save hours:
- Index symbols like SPX, RUT and NDX sometimes return incomplete gamma or open-interest fields. The gex_app repository handles that with an ETF-proxy fallback.
- Schwab’s option chain response is JSON, and the field layout is mapped in this schwab_api option chain model.
Label your output modeled GEX. The market never tells you whether dealers are long or short each contract, a limitation spelled out in Delvantic’s analysis of GEX assumptions.
How do you build a gamma exposure dashboard with the Schwab API?
Build it in five steps: register a developer app, complete OAuth, pull the option chain, compute dollar gamma per strike, then plot it. Schwab access is OAuth-based rather than key-only, with app registration, callback URLs, an authorization-code exchange and token refresh, as described in the Schwab market data API listing.
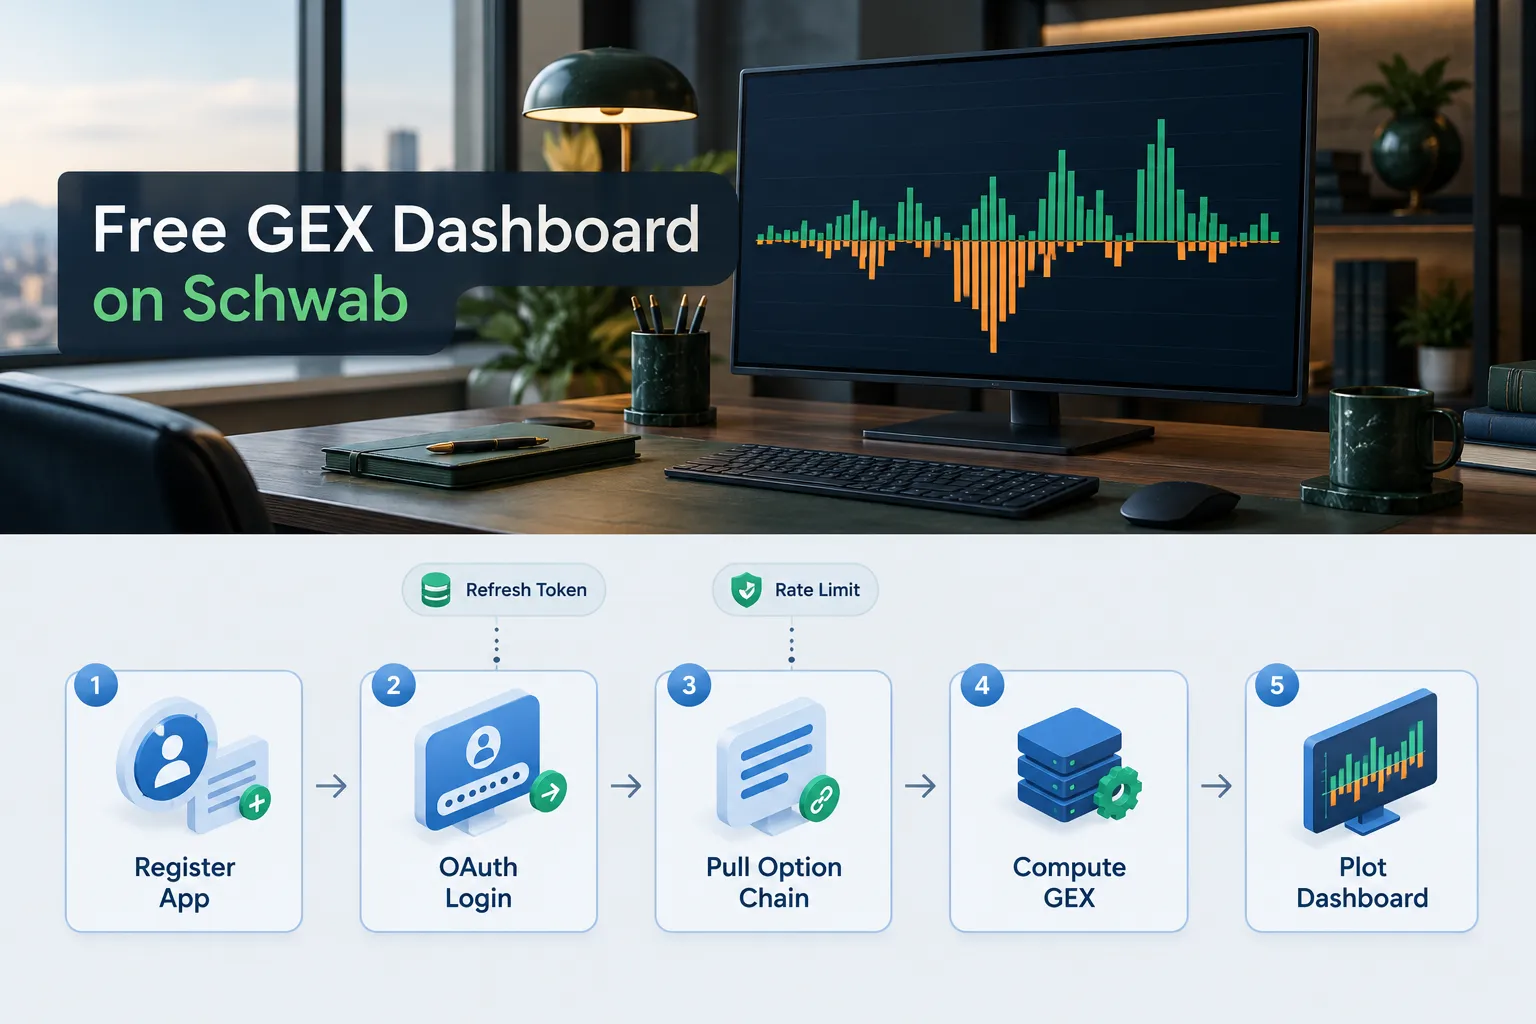
Getting started checklist
- Register the app. Separate entitlements exist for market data and trading. Start with market data only.
- Handle tokens. Roughly 30-minute access tokens, about 7 days for refresh, per schwabpy. Automate the refresh or you will re-auth every Monday.
- Respect limits. Treat 120 requests per minute as a ceiling and back off on HTTP 429, since Schwab rate-limit documentation warns quotas vary by application.
- Compute per strike. For each strike, multiply gamma by open interest by 100 by spot squared by 0.01, make puts negative, and store the result by strike. Check one strike by hand before you touch charting. Most schwab api python projects keep this step separate from the API calls, which makes it easy to test.
- Plot it. A charting library like Plotly or Dash turns those per-strike totals into a gamma exposure chart with very little extra work.
Skip the typing and clone instead. The gamma-exposure GitHub topic lists a self-hosted Docker GEX dashboard advertised as no-coding-required and using no paid APIs, and the broader Schwab topic page carries related wrappers. There is also a video walkthrough: Build a Real-Time Net GEX Model Using Schwab API and Python.
For deeper setup, our Schwab API guide covers auth and the usual schwab api python libraries, and our Python algorithmic trading walkthrough covers project structure. On legal terms, read your entitlement agreement before redistributing data. Personal use and commercial resale are not the same thing.
Can you get a gamma exposure chart free or on TradingView?
Yes, partly. Free gamma exposure chart options exist in three flavors: open-source Schwab projects, free tiers on commercial dashboards, and TradingView community indicators that estimate gamma from third-party feeds rather than live chains.
TradingView does not publish a native gamma exposure product. Community scripts labeled gamma exposure TradingView typically pull external or static data, so verify the source before trusting a level. Free alternatives to the big options-flow desks are catalogued in this roundup of free Unusual Whales alternatives, and 0DTE data feeds are compared in this 2026 options data API comparison.
For the charting side generally, our breakdown of free stock charts across TradingView, Finviz and Yahoo is a useful companion, and the free AI tools hub lists calculators that pair with a GEX workflow.
What can GEX not tell you about SPY and other tickers?
GEX cannot tell you dealer intent, next week’s direction, or whether a wall will hold. Gamma exposure SPY readings are an estimate built on an assumption: that dealers are long the calls and short the puts that customers trade. When customer positioning flips, the sign flips with it.
The honest limitations list:
- Open interest updates once per day. Intraday 0DTE flow can move real exposure before your chart knows.
- Modeled, not observed. The dealer convention is inference, as Delvantic notes.
- Academic support is not vendor validation. A recent arXiv paper on inferring latent market forces reported 91.2% forward-return materialization accuracy for its own detection framework. That number says nothing about your Schwab OI dashboard.
- Past levels expire. A Jan monthly wall stops mattering after Jan expiry.
Common mistakes: trading the wall without a stop loss, ignoring volume confirmation, and treating gamma as a signal rather than context. A level is a place to manage risk-reward, not a prediction.
Top 5 favorite features of a self-built GEX dashboard
The five things a DIY build gives you that a subscription rarely does: your own strike filters, your own expiry weighting, raw data access, unlimited tickers, and no paywall standing between you and a level.
- Custom strike profile range. Trim the tails that inflate net GEX.
- Expiry weighting you control. Separate 0DTE from monthlies instead of accepting a blended number.
- Raw JSON retained. Store chains daily and you have a free research archive for options backtesting.
- Any ticker with options. Not just the vendor’s covered list.
- Signals on your terms. Alert on flip crossings only, nothing else.
What we like and what we don’t like
Worth it if you can read Python and want data ownership. Not worth it if you need levels at 9:25 tomorrow and have never touched OAuth.
What we like: no extra data fee for Schwab account holders, a published formula you can audit, active open-source repos on the gamma-exposure topic, and full control over assumptions.
What we don’t like, two real drawbacks: first, token maintenance is relentless, with 7-day refresh expiry meaning a dashboard left alone for a week is dead on Monday. Second, Schwab rate limits are inconsistently documented, so polling behavior that works in testing can throw HTTP 429 in a fast tape. Add a third: there is no support desk. You are the support desk.
What do real users say?
Self-builders say the hard part is access, not math. In the r/options thread Built my own Gamma tools, a trader reports it was easy to build once they had a Schwab account.
Platform shopping is still active. A Reddit discussion on the best platform for tracking GEX gamma shows traders comparing hosted dashboards against rolling their own. Treat forum sentiment as one input, not a verdict.
Competitors and alternatives
Paid GEX desks win on speed to first useful level. The self-built route wins on cost and control. Pick based on whether your scarce resource is money or time.
| Option | Data source | Best for | Price |
|---|---|---|---|
| Self-built Schwab dashboard | Schwab Trader API chains | Python-capable traders | No separate data fee beyond your account |
| SpotGamma | Proprietary models | Index and SPX traders | Check official pricing page |
| MenthorQ | Proprietary levels plus integrations | Futures and NQ traders wanting plotted levels | Check menthorq.com pricing page |
| Unusual Whales | Flow and options analytics | Flow-first traders | Check official pricing page |
| DeepCharts | Charting with gamma overlays | Visual traders | Check official pricing page |
Alternatives to the biggest name are listed in this SpotGamma alternatives directory. Some paid desks plot their levels directly on third-party charting platforms, which a DIY gamma exposure dashboard can replicate only with extra work. We have not verified current pricing for any paid desk here, so check each vendor page directly.
Our Take
Build it if you already write Python. Subscribe if you don’t. A self-built gamma exposure chart is one of the few genuinely free upgrades available to a retail options trader, and the formula has been public since the SqueezeMetrics era.
The trap is thinking the dashboard is the edge. It isn’t. The levels are context for position sizing and stop placement, which is why pairing GEX with a swing trade position size calculator and a trading expectancy calculator matters more than another panel. Paper trade it first. Then size up.
Next step: clone a repo from the gamma-exposure topic, run it on SPY for 10 sessions, and log whether the Call Wall held. Ten days of your own data beats ten opinions.
Submit a bot or dashboard for review: aistocktradingbots.com/contact
Conclusion
A gamma exposure chart is a positioning map, not a crystal ball. The math is published, Schwab supplies the inputs, and open-source code shortens the build to an afternoon. What it cannot do is tell you whether dealers are really positioned the way the model assumes.
Start simple: one ticker, one strike profile, one flip level, logged daily for two weeks. Add the heatmap, the skew view and the intraday delta GEX panel only after the basic chart earns your trust. For broader context on building systems rather than collecting indicators, see our notes on free option backtesting and running an AI-assisted trading bot. Process over prediction.
This article is education, not financial advice. Past results and modeled levels do not predict future return.
Your market edge starts with the right tool. Stay alpha.
Frequently Asked Questions
What does gamma exposure tell us?
Gamma exposure estimates how much hedging options dealers must do as price moves. High positive gamma suggests dealers buy dips and sell rips, compressing ranges. Negative gamma suggests the opposite, with hedging adding fuel to moves. It describes likely flow, not direction, and it is an inference from public open interest.
How do I calculate gamma exposure?
Multiply each strike's gamma by its open interest, by the 100-share contract multiplier, by spot price squared, by 0.01. Count calls positive and puts negative, then sum every strike for net GEX. The crossing point where net gamma hits zero is the flip level. Schwab's option chain supplies the gamma and open interest fields.
What does a higher gamma exposure gauge tell you?
A higher reading means dealers are estimated to be longer gamma, which tends to pair with tighter ranges and faster mean reversion. Expect dip buying and rally selling from hedgers, smaller realized moves, and breakouts that struggle to follow through until the gauge falls toward the zero gamma flip.
What does it mean to have negative gamma exposure?
Negative GEX means dealers are modeled as short gamma, so they hedge in the same direction as price. They sell into weakness and buy into strength, which amplifies swings. Negative gamma regimes tend to bring wider ranges, trend persistence and higher realized volatility.
Is there a free gamma exposure chart?
Yes. Open-source Schwab projects on GitHub's gamma-exposure topic give you a self-hosted gamma exposure chart free of data charges if you hold a Schwab account. Several commercial dashboards also offer limited free tiers. Free usually means stale open interest, fewer tickers, and no support, so verify data freshness first.
Does TradingView have gamma exposure?
TradingView has no native gamma exposure product. Community indicators labeled gamma exposure exist, but they rely on external or manually updated data rather than live option chains, so accuracy varies by script. If you need current GEX levels on a TradingView chart, most traders compute them elsewhere and plot the levels manually.
What is gamma exposure on SPY?
Gamma exposure on SPY is the net dollar gamma across SPY option strikes, used to locate the Call Wall, Put Wall and flip level on one of the most heavily traded ETFs. SPY and SPX readings often differ because of contract notional size and expiry mix, so traders usually track both rather than assuming they match.
Contributing writer at AI Stock Trading Bots.
