

The FullStack Alpha research desk tests AI trading bots on paper and live accounts. Reviewed and edited by Jay Rocco, Founder and Editor.
By FullStack Alpha Editorial Team | Reviewed by Jay Rocco, Chief Editor
Walk forward analysis is a backtesting method where you tune a strategy’s settings on one slice of historical data, then test those frozen settings on the next slice the strategy has never seen, then roll the whole window forward and repeat. It catches overfitting because a curve-fit bot looks brilliant on the data it was tuned on and falls apart on the data it wasn’t. The one comparison to run: in-sample return versus out-of-sample return, same strategy, same costs. If out-of-sample keeps roughly a third or more of the in-sample result across most windows, you have something worth paper trading. If it collapses, you built a very expensive memory of the past.
What You Should Know
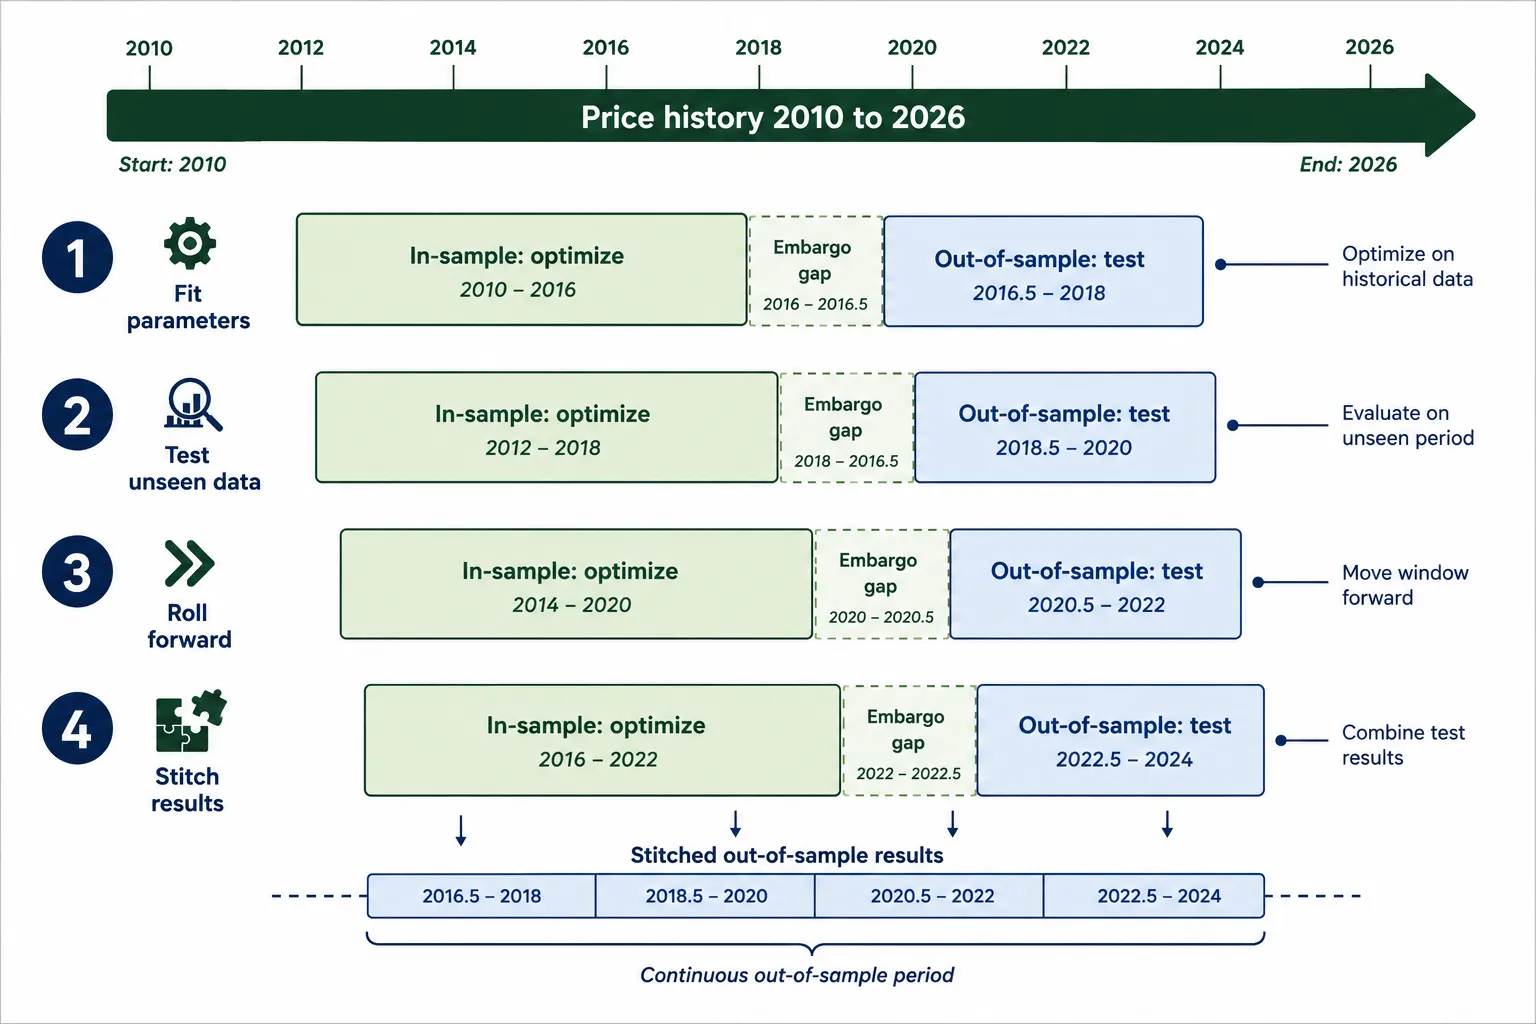
- Robert Pardo is widely credited with formalizing walk forward analysis for trading-system development. The core rule: judge a strategy on data it did not help select.
- A January 22, 2026 arXiv paper by Alexander Pearson Sheppert ran 5,340 walk-forward trials across 50 S&P 500 stocks (2010-2024) and reported a validation-to-training return ratio of 0.365 for its GT-Score objective versus roughly 0.185 for profit- and Sharpe-based objectives.
- An August 10, 2026 study (Deep, Deep, and Lamptey, Texas Tech) used 34 independent test folds on 100 U.S. equities and got 0.55% annualized return, 0.33 Sharpe, and a p-value of 0.34. They published it as statistically insignificant. That’s what honest walk forward testing looks like.
- Bailey and López de Prado’s Deflated Sharpe Ratio adjusts a Sharpe figure for how many variants you tested. A 2.0 Sharpe found on trial 900 is not a 2.0 Sharpe.
- As of October 2026, no major financial regulator mandates walk forward analysis by name for retail or institutional bots. Anyone telling you it’s a legal requirement is selling something.
What Is Walk Forward Analysis?
Walk forward analysis is a way of testing a trading strategy that splits history into repeating pairs of windows: an in-sample window where you optimize the parameters, and an out-of-sample window where you test those exact parameters on data the optimizer never touched. Then you slide both windows forward and do it again, a dozen or thirty times, and stitch the out-of-sample results into one continuous equity curve.
That stitched curve is the only number that means anything. Everything else is homework.
Two terms get used almost interchangeably, so here’s the difference:
- Walk forward optimization is the tuning half. Inside each in-sample window, you search for the parameter set that scores best on whatever fitness measure you chose (net return, Sharpe ratio, profit factor, drawdown-adjusted return).
- Walk forward testing is the verification half. You take those winning parameters, freeze them, and run them forward on the next untouched chunk of price action.
Do both, repeatedly, rolling forward, and you have walk forward analysis.
QuantConnect’s documentation describes the same idea in platform terms: periodically re-fit a model using a trailing historical window, then apply it to subsequent data. Their framework includes a train schedule so you can re-optimize monthly or on any interval you pick. AmiBroker’s walk forward documentation follows the same structure Pardo laid out decades ago.
The whole point is simulating the one thing a normal backtest can never simulate: not knowing what happens next.
Here’s the analogy that makes it click. A normal backtest is studying with the answer key open. Walk forward analysis is studying chapter one, closing the book, taking a quiz on chapter two, then studying chapter two and getting quizzed on chapter three. Same material. Wildly different grade.
Who needs it and who doesn’t
Run walk forward analysis if:
- Your strategy has tunable numbers (moving average lengths, RSI thresholds, stop distances, lookback periods). Anything you adjusted to make the backtest look better.
- You tested more than about 20 parameter combinations before settling on one.
- You plan to put real money behind it.
You can skip it if your strategy has zero free parameters and you never looked at results before writing the rules. That describes almost no one. If you tried 14 moving-average lengths and kept the one with the prettiest curve, you need this.
Why Does a Normal Backtest Fool Bot Builders?
A normal backtest fools you because it tests the strategy on the same data you used to build the strategy. Every tweak you made was informed by what already happened, so the result isn’t a forecast of performance. It’s a scorecard of how well you memorized 2018 through 2024.
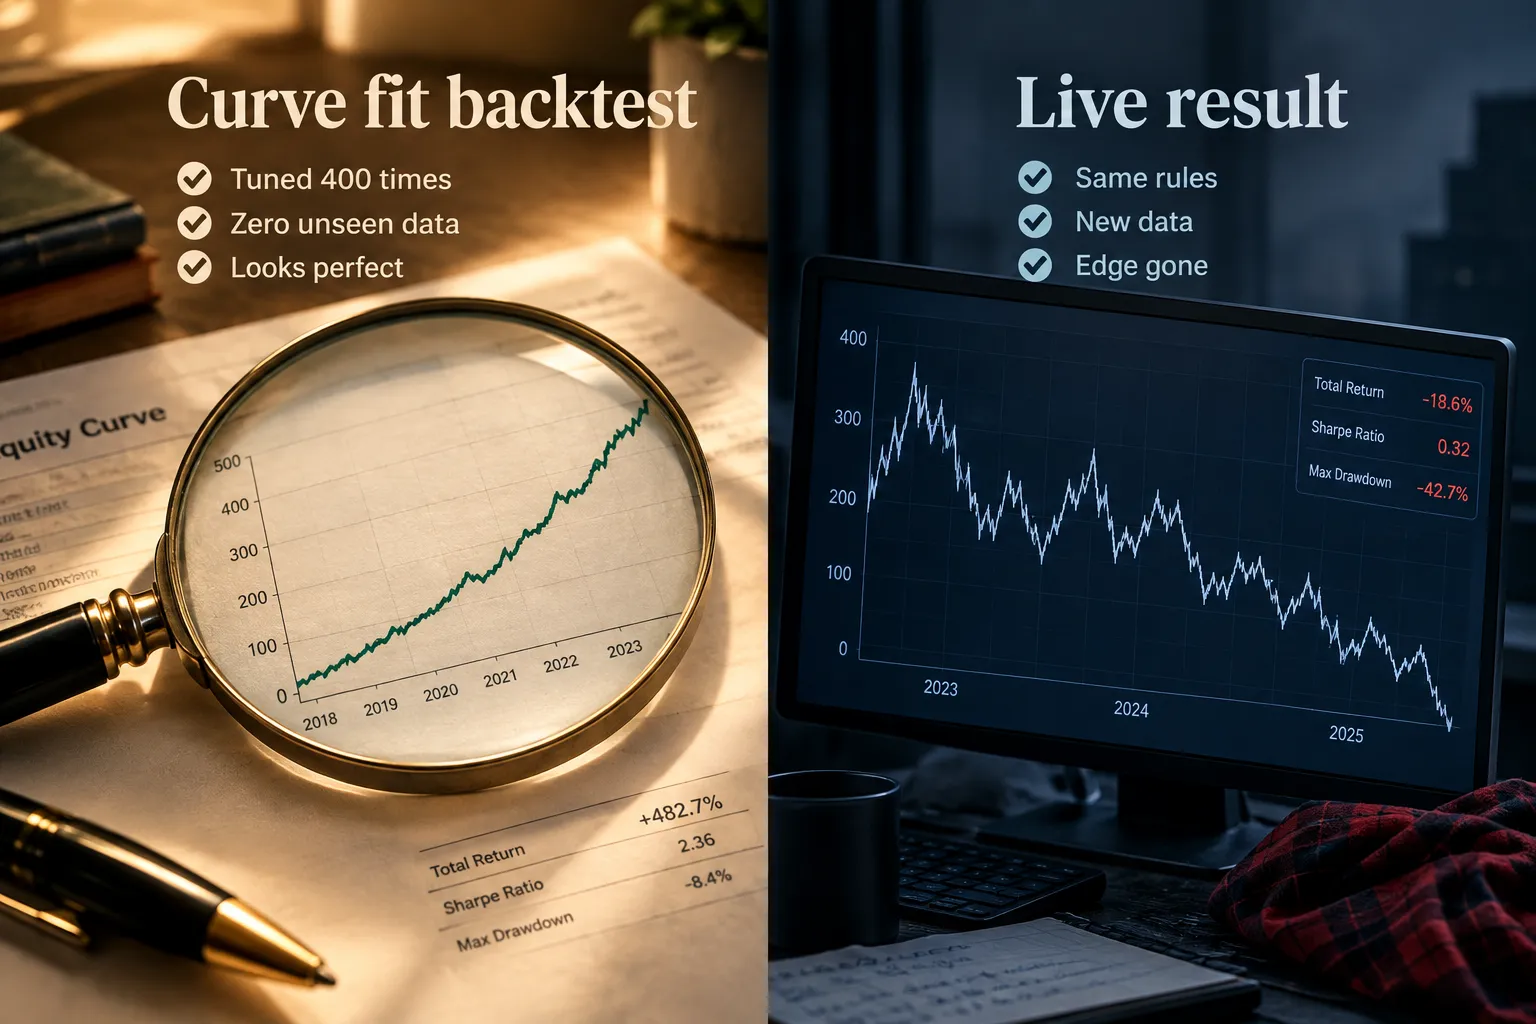
That’s overfitting: fitting the rules so tightly to historical noise that the rules stop describing anything repeatable.
A worked example of how it happens
Say you’re building a bot for SPY. You start with a simple moving average crossover.
- You test 10/30. Returns 6% a year. Meh.
- You test 12/26. Returns 9%. Better.
- You add an RSI filter above 50. Returns 14%.
- You skip trades in August because August was bad. Returns 17%.
- You widen the stop from 2% to 2.4% because three losers got stopped before reversing. Returns 21%.
- You repeat steps 2 through 5 about forty more times.
You now have a 21% backtest and a strategy that is, functionally, a description of what already happened. The August rule isn’t an insight. It’s two bad Augusts in your sample. The 2.4% stop isn’t risk management. It’s three specific trades.
Every parameter you add is another chance to memorize noise instead of finding an edge.
Bailey, Borwein, López de Prado and Zhu formalized this with the Probability of Backtest Overfitting, which asks a blunt question: how often does the strategy that wins in-sample end up below median out-of-sample? If your search was wide enough, the answer is roughly a coin flip. Their Deflated Sharpe Ratio work makes the same point from a different angle: a Sharpe ratio picked from hundreds of trials deserves a haircut, because with enough attempts, something always looks great by luck.
The other backtest killers riding along
Overfitting rarely travels alone. Three companions show up in nearly every retail backtest:
- Look-ahead bias: your code uses information that wasn’t available at the moment of the trade. Using the day’s closing price to decide an entry that fires at the open is the classic version. More on that in our breakdown of look-ahead bias in trading backtests.
- Ignored costs: commissions, spread, borrow, and slippage. A strategy that trades 400 times a year lives or dies on fills. See paper trading and slippage.
- Survivorship bias: testing on today’s index members and quietly excluding everything that got delisted. The Texas Tech team explicitly disclosed this as a limit on their own 2026 study, which is more honesty than most vendor backtests offer.
Walk forward analysis fixes exactly one of these: overfitting. It does nothing about the others. Fix those separately, before you start. A clean walk forward test on dirty data is a confident wrong answer.
If you want the longer catalogue of ways these systems break, we keep one at why trading bots fail.
How Does Walk Forward Analysis Work Step by Step?
You split your price history into overlapping in-sample and out-of-sample pairs, optimize on the in-sample block, test the frozen parameters on the out-of-sample block, record only the out-of-sample result, then slide both windows forward by one step and repeat until you run out of data.
Here’s the full sequence.
Step 1: Fix everything that isn’t a parameter
Before you optimize anything, lock down your data source, your commission model, your slippage assumption, your universe, and your entry and exit logic. Write them down. If you change these later because results looked bad, you’ve started meta-overfitting, and we’ll get to why that’s a problem.
Step 2: Choose your window sizes and step
Three numbers to pick:
- In-sample length: how much history the optimizer gets. The 2026 GT-Score study used four years.
- Out-of-sample length: how much untouched data you test on. That study used two years.
- Step size: how far you roll forward each cycle. That study used one year, which means consecutive in-sample windows overlap heavily.
The same study added a 30-day embargo between the training window and the validation window, a deliberate gap so a trade opened at the end of training doesn’t bleed into the test period. Sheppert presents these as design decisions, not universal defaults. Copying them blindly is its own kind of cheating.
Step 3: Optimize inside window one
Run your parameter search across the in-sample block only. Pick the winner by whatever fitness function you declared in step 1.
A guardrail worth stealing from that paper: they required a minimum of 50 trades for any parameter configuration to qualify. That stops you from crowning a setup whose entire record is four lucky trades. Set your own minimum before you start. Thirty is a floor, fifty is better.
Step 4: Test on window two, change nothing
Apply the frozen parameters to the out-of-sample block. No adjustments. No “well, obviously I’d have noticed that regime change.” Record the result.
If you touch the parameters after seeing out-of-sample results, that data is now in-sample and it’s burned. You don’t get it back.
Step 5: Roll forward and repeat
Slide both windows by your step size. Re-optimize. Re-test. Keep going. The 2026 Texas Tech study generated 34 independent test periods using 252 training days, 63 testing days, and a 63-day roll. More folds means more statistical weight behind whatever you conclude.
Step 6: Stitch and judge
Chain every out-of-sample segment into one curve. That’s your honest result. The in-sample curves get thrown away.
The worked table
A 10-year sample, 3-year in-sample, 1-year out-of-sample, 1-year step:
| Window | In-sample (optimize) | Out-of-sample (test) | Result |
|---|---|---|---|
| 1 | Jan 2016, Dec 2018 | Jan 2019, Dec 2019 | IS +34%, OOS +11% (ratio 0.32) |
| 2 | Jan 2017, Dec 2019 | Jan 2020, Dec 2020 | IS +41%, OOS +6% (ratio 0.15) |
| 3 | Jan 2018, Dec 2020 | Jan 2021, Dec 2021 | IS +38%, OOS +14% (ratio 0.37) |
| 4 | Jan 2019, Dec 2021 | Jan 2022, Dec 2022 | IS +36%, OOS −9% (ratio negative) |
| 5 | Jan 2020, Dec 2022 | Jan 2023, Dec 2023 | IS +29%, OOS +10% (ratio 0.34) |
| 6 | Jan 2021, Dec 2023 | Jan 2024, Dec 2024 | IS +31%, OOS +12% (ratio 0.39) |
Illustrative numbers, not a real strategy. But read what they say. In-sample is consistently in the thirties. Out-of-sample averages around 7.3% with one losing year. The efficiency ratio sits near 0.3, which is roughly in the neighborhood of what the 2026 GT-Score research reported for well-constructed objectives (0.365) and better than the 0.185 it reported for raw profit optimization.
Four of six windows profitable is 67%. For reference, the Texas Tech reinforcement-learning study managed 41% profitable test folds across 34 periods with 140 total trades, and reported a 95% bootstrap confidence interval for quarterly returns of −0.12% to +0.43%. They called it insignificant. They were right to.
What Is Out of Sample Testing and How Is It Different?
Out of sample testing means evaluating a strategy on data that played no role in building it. Walk forward analysis is a specific, repeating form of out of sample testing, where the split happens over and over as the windows roll forward instead of just once at the end.
The simple version most people run is a single holdout: optimize on 2015-2022, test on 2023-2026, done. That’s out of sample testing. It’s better than nothing. It has two problems.
Problem one: it’s one sample. Your entire verdict rests on whichever market regime happened to land in that final block. Test on 2023 and you’re grading a strategy on a bull market. Test on 2022 and you’re grading it on a rate-shock selloff. One fold, one answer, no idea which.
Problem two: you’ll peek. You run the holdout, it looks bad, you go back and tweak. Run it again. Still bad. Tweak again. After the third pass, your holdout is in-sample and you’ve just performed a slow, dishonest optimization.
Walk forward analysis fixes both by producing many out-of-sample segments across many regimes, which makes the result a distribution instead of a single number.
| Single holdout test | Walk forward analysis | |
|---|---|---|
| Number of out-of-sample periods | 1 | 10 to 40+ |
| Regimes covered | Whatever’s in that block | Bull, bear, chop, across years |
| Re-optimizes as markets change | No | Yes, every roll |
| Tells you if the edge is stable | No | Yes, fold by fold |
| Time to run | Minutes | Hours to days |
| Risk of accidental peeking | High | Lower, not zero |
Choose the single holdout if you’re screening twenty strategy ideas quickly and want to kill the obvious failures. It’s a cheap filter.
Choose walk forward analysis if a strategy survived the screen and you’re deciding whether to fund it. That’s the real decision, and it deserves the real test.
How Do You Add a Monte Carlo Stress Test?
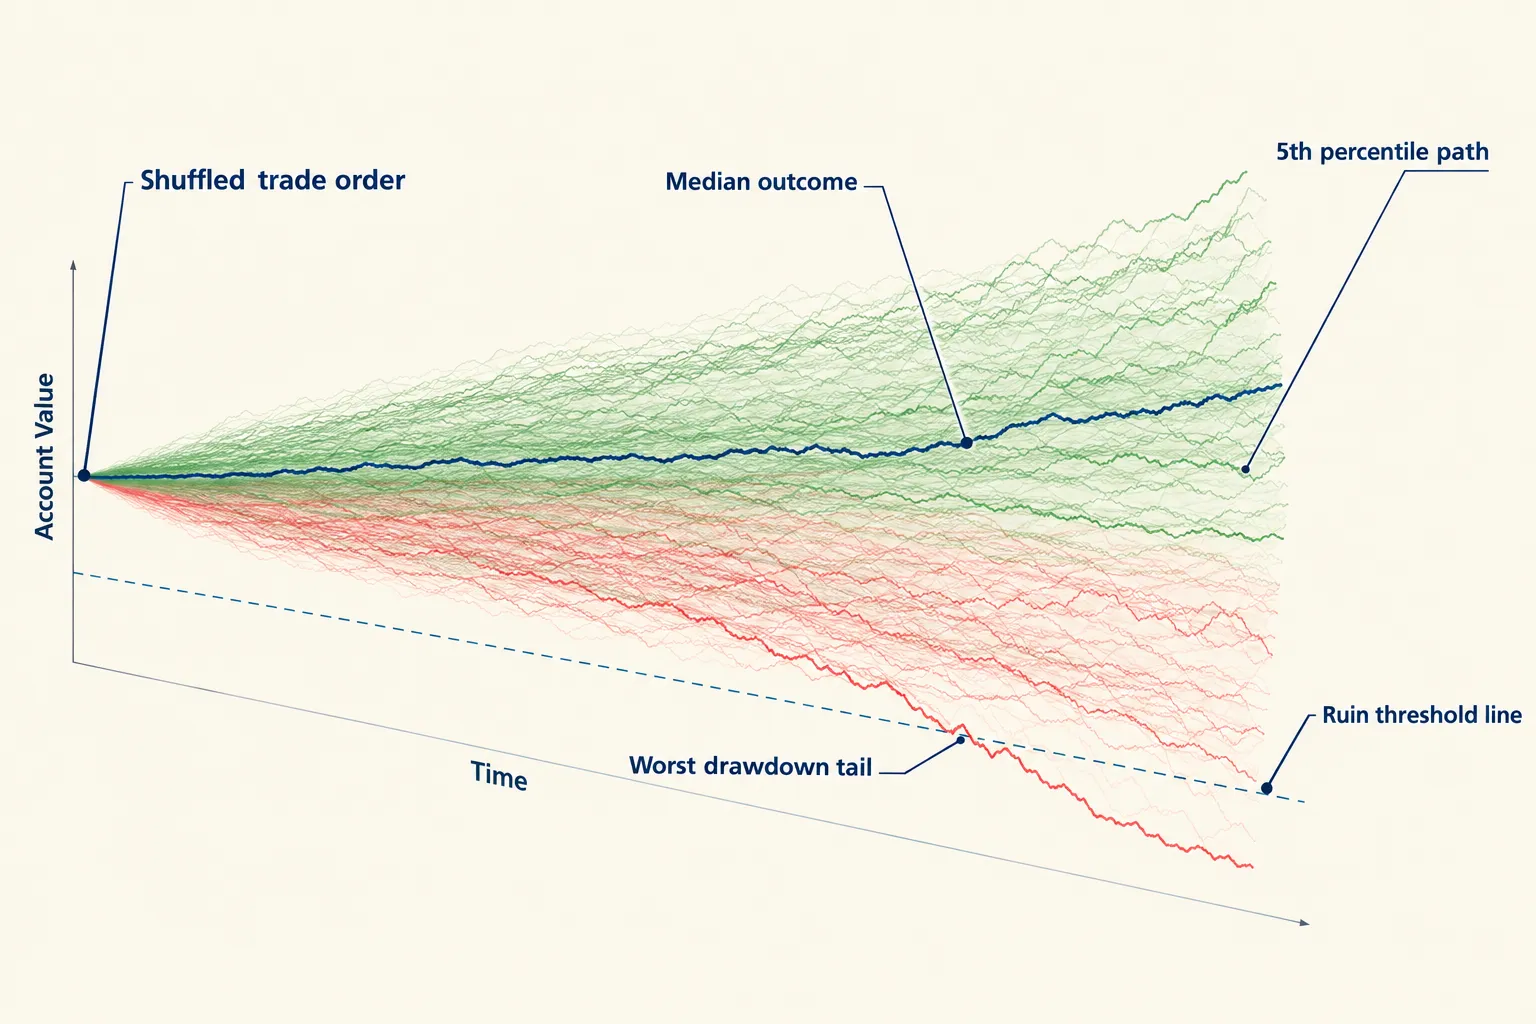
Monte Carlo simulation in trading takes your out-of-sample trade results and reshuffles them thousands of times, randomizing the order of trades and sometimes the size of each result, to produce a range of possible equity curves instead of the single path history happened to deliver. It answers a different question than walk forward analysis: not “is this edge real” but “how bad could the ride get even if it is.”
What it actually does
Your walk forward test produced, say, 180 out-of-sample trades. The order they arrived in was luck. Had your three biggest losers clustered in March instead of spreading across two years, your drawdown would have looked very different and you might have quit.
Monte Carlo simulation trading tests rebuild that curve 5,000 or 10,000 times with the trades in random order. Some runs front-load the winners. Some stack the losers. You end up with a distribution of outcomes.
What it shows you
- Worst-case drawdown, not best-case. Your historical max drawdown was probably not the worst one available. The 5th percentile simulated drawdown is a more honest planning number. The Texas Tech study reported a −2.76% max drawdown on its historical path; a Monte Carlo pass would tell you how much worse the tail gets.
- Risk of ruin. What fraction of simulations drop below the point where you’d stop trading or hit a margin call? If 8% of runs blow past your pain threshold, your position sizing is too aggressive regardless of expected return.
- How wide the outcome range is. A strategy with a median annual return of 12% and a 5th-to-95th percentile range of −4% to +31% is a different animal from one with the same median and a range of +6% to +18%.
How to run it, without code
The mechanics, described plainly:
- Export the list of out-of-sample trade returns from your walk forward run. Percentage per trade, in sequence.
- Shuffle the list randomly. Compound the shuffled sequence to build an equity curve.
- Record the final return, the maximum drawdown, and whether the curve ever breached your ruin threshold.
- Repeat steps 2 and 3 at least 5,000 times.
- Sort all outcomes and read the percentiles: 5th, 25th, 50th, 75th, 95th.
Most backtesting platforms have this built in. Several of the tools we cover in our free backtesting software roundup include a Monte Carlo module, and most of the backtesting websites worth paying for do too.
The limitation no one mentions
Shuffling assumes your trades are independent. They often aren’t. Trend strategies produce streaks by design, because trends persist. Randomizing the order destroys that structure and can make drawdowns look either better or worse than reality.
Use Monte Carlo for sizing decisions, not for deciding whether the edge exists. Walk forward analysis answers the second question. They’re complements, not competitors. If someone asks which is better, they’ve misunderstood what each one does.
How Do You Read the Results?
Read walk forward results by comparing in-sample performance to out-of-sample performance across every fold, and by counting how many folds were profitable. Set your pass thresholds before you run the test, in writing, and then live with them.
That last part is where most people fail. Thresholds chosen after seeing results aren’t thresholds, they’re rationalizations.
The four numbers that matter
1. Walk forward efficiency ratio. Out-of-sample return divided by in-sample return. The 2026 GT-Score research reported 0.365 for its best objective and about 0.185 for profit- and Sharpe-optimized strategies, a roughly 98% improvement in generalization. The GT-Score strategies had lower raw returns. They kept more of what they promised.
2. Percentage of profitable folds. Count the out-of-sample windows that made money. Six of ten is 60%. The Texas Tech study hit 41% of 34 folds and treated that as a failing grade for live deployment.
3. Degradation in drawdown. If in-sample max drawdown was 8% and out-of-sample is 19%, your risk model is wrong even if returns held up.
4. Statistical significance. The 2026 reinforcement-learning paper reported p = 0.34 and said plainly that the returns were not significant. If your strategy can’t clear a basic significance test across 100+ trades, you have an expensive hobby.
Set your own thresholds first
Here’s a template. Fill in your own numbers, then don’t move them.
Before running walk forward analysis, I commit to these pass conditions:
- Efficiency ratio above ____ (example: 0.30)
- Profitable out-of-sample folds above ____% (example: 60%)
- Out-of-sample max drawdown no more than ____x the in-sample figure (example: 1.5x)
- Minimum ____ total out-of-sample trades (example: 100)
- If fewer than ___ of these pass, the strategy does not go live.
These are illustrative. They are not industry standards, because there aren’t any. What matters is that you wrote them down first.
Why your walk forward results look worse than your backtest
Because they’re supposed to. If walk forward results matched your backtest, either the strategy has almost no tunable parameters, or your test is leaking data somewhere.
The gap between the two numbers is the measurement. It tells you how much of your backtest was skill versus memorization. A strategy that drops from 34% in-sample to 11% out-of-sample hasn’t failed. It’s told you the truth: the honest expectation is around 11% before live frictions, and probably less after.
A smaller drop is a better strategy, even at a lower absolute return. That’s the whole trade-off the GT-Score research demonstrated: profit-optimized strategies showed higher raw test returns (roughly 46%,49% in their Monte Carlo experiment) but generalized far worse.
How to optimize parameters during walk forward testing
Four rules that keep the optimization half honest:
- Fewer parameters. Every free parameter multiplies the search space and the overfitting risk. Three is manageable. Eight is a memory exercise.
- Pick a fitness function that isn’t raw profit. The 2026 research is explicit here: objectives blending return, statistical significance, consistency, and downside risk generalize better than profit or Sharpe alone.
- Prefer parameter plateaus to peaks. If 14 works great and 13 and 15 are terrible, 14 is noise. If 12 through 18 all work decently, you’ve found something structural.
- Enforce a trade minimum. The 50-trade floor from the GT-Score study exists for a reason.
Can Claude Code or ChatGPT Run a Walk Forward Test for You?
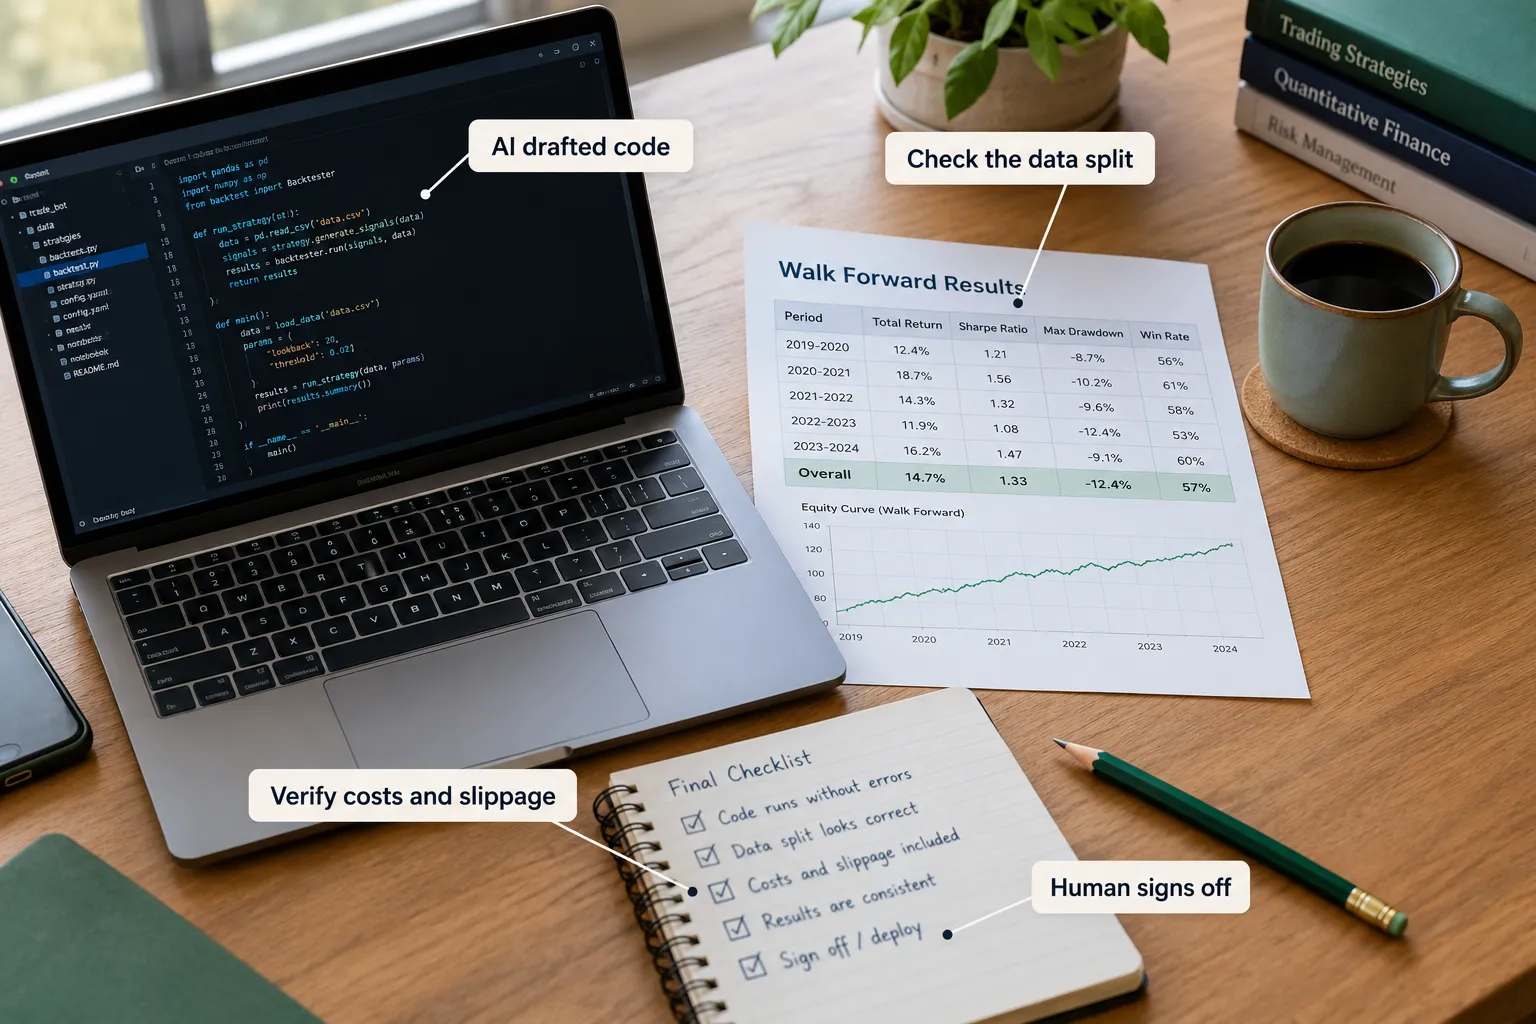
AI can write the walk forward analysis code faster than you can, and it will get the loop structure right most of the time. What it cannot do is verify that the data is clean, that your costs are realistic, or that the result means what you think it means. Can ChatGPT backtest a trading strategy? It can write the backtester. It can’t tell you the backtester is lying.
What AI genuinely does well here
- Scaffolding the rolling window loop. Splitting dates, iterating folds, freezing parameters between stages. Tedious, mechanical, and well within reach.
- Explaining why a result looks odd. Paste in a fold-by-fold table and ask what’s suspicious. Good at spotting the pattern you’ve gone blind to.
- Converting a strategy description into testable rules. Vague ideas into explicit entry and exit conditions with no ambiguity.
- Writing the Monte Carlo reshuffle routine. Genuinely simple code that’s easy to get subtly wrong by hand.
What you must check yourself
- Look-ahead leakage. AI-written backtests introduce this constantly, usually by indexing a bar one position off. Print a few trades and verify, by hand, that every input existed before the entry timestamp.
- Cost assumptions. Unless you specify commission, spread, and slippage, the generated code will assume zero. Zero is not a number that exists.
- Whether the data is survivorship-free. The model has no idea what’s in your CSV.
- Trade counts per fold. AI happily reports a glowing fold built on six trades.
- That parameters are actually frozen. Re-read the loop. Confirm the optimizer cannot see the test window.
Which AI is best for backtesting trading?
Honest answer: the one you’ll audit. Tools with a code execution environment (Claude with code execution, ChatGPT’s data analysis mode) are more useful than chat-only models because they run the code and show you the output. But the model is a junior developer with no market experience and infinite confidence. Treat every line as a draft.
Never fund a strategy whose backtest you haven’t read line by line. If you can’t follow the code, you can’t trust the number, and the number is the entire basis for risking money.
For options strategies in particular, the complexity of modeling expiry, assignment, and bid-ask spreads means AI-generated code fails more often than it works. Our walkthrough on options backtesting covers why.
The mistake that undoes all of it
Meta-overfitting. You run walk forward analysis, results look bad, so you change the window length. Still bad, so you change the step size. Then the fitness function. Then the asset universe. Then you add a volatility filter. Twelve configurations later the stitched curve looks beautiful and you’ve just performed a slower, more sophisticated version of the exact curve-fitting you set out to detect.
TradingStrategy.ai’s methodology discussion flags this directly. The fix is boring and effective: decide your window sizes, step, costs, and fitness function in advance, write them in a file, and run the test once. If it fails, the strategy failed. Changing the test until it passes is the oldest trick in the book, and the only person it fools is you.
Other frequent errors worth naming:
- Too little data. You need enough history for multiple folds and a trade minimum per fold. A rough floor: 8 to 10 years of daily data for a swing strategy, so you get 6+ independent folds of a year or more. Intraday strategies need less calendar time but far more bars. Fewer than five out-of-sample folds and your conclusion is anecdote.
- Testing one asset. An edge that only works on NVDA is a story about NVDA.
- Ignoring regime. If every out-of-sample window lands in a bull market, you’ve tested one condition six times.
- Declaring victory after walk forward. It’s a filter, not a certificate. Paper trade it first, with live fills, for a meaningful stretch.
Is walk forward analysis worth the time for a small retail trader?
Yes, if you’re running an automated strategy with real money. No, if you’re discretionary.
The math is simple. A thorough walk forward run costs maybe 10 to 20 hours including cleanup and re-runs. A curve-fit bot running on a $5,000 account can give back 20% before you accept it’s broken. That’s $1,000 to learn what 15 hours would have told you for free.
For discretionary traders who don’t optimize numeric parameters, the overfitting mechanism barely applies. Your risk is different: inconsistency, revenge trading, abandoning rules mid-drawdown. Walk forward analysis doesn’t fix behavior.
And can it guarantee a profitable bot? No. Nothing can. It’s a disqualifier, not a predictor. It removes strategies that were never real. It does not promise the surviving ones will work tomorrow, because markets change, edges decay, and your 2019-2024 sample contains exactly zero information about 2027. QuantConnect’s own research guidance recommends walk forward analysis for reducing overfitting and conspicuously stops short of claiming it guarantees live profitability.
Frequently Asked Questions
What is a walk forward test?
A walk forward test optimizes a trading strategy’s parameters on one block of historical data, then applies those frozen parameters to the next untouched block, then rolls both blocks forward and repeats. Only the untouched-block results count. The method was formalized by Robert Pardo and is implemented in platforms including AmiBroker and QuantConnect.
How do you backtest for beginners?
Start with one market, one timeframe, and rules so explicit a stranger could follow them. Pull at least five years of clean daily data, include commission and slippage from the first run, and record every trade. Then run a simple out-of-sample split before you attempt anything fancier.
Can I backtest for free?
Yes. TradingView’s strategy tester, QuantConnect’s research environment, and Python with pandas all cost nothing to start. Free tiers usually limit data history, data quality, or how many optimization runs you get, which matters most when you’re doing walk forward analysis across many folds.
Can ChatGPT backtest a trading strategy?
It can write and run backtest code in a data-analysis environment, but it cannot verify your data quality, catch look-ahead bias you didn’t ask about, or judge whether results are statistically meaningful. Treat generated code as a first draft from a junior developer and audit the trade log by hand.
Which AI is best for backtesting trading?
Whichever one executes code and shows you the output, so you can check the work. Chat-only models that describe results without running anything are the worst option, because they’ll produce confident numbers with nothing behind them. The audit matters more than the model.
How much data do you need for walk forward analysis?
Enough for at least five or six independent out-of-sample folds, each clearing a minimum trade count. For a daily swing strategy, that generally means 8 to 10 years. The 2026 GT-Score study used 2010-2024 with nine sequential splits; the Texas Tech study used 2015-2024 with 34 shorter folds.
Our Take
No bot trades live money until it has passed a walk forward analysis with thresholds you wrote down before you ran it. Not after. Before.
A strategy that drops from 34% in-sample to 11% out-of-sample isn’t a disappointment. It’s the first honest number you’ve seen, and honest beats pretty every time you have capital at risk. The fancy backtest was always a story about the past. Discipline beats prediction.
Related: if you run the test in TradingView’s strategy tester, our TradingView tool profile covers what the platform can and can’t do, and the platform reviews at AI Stock Picker App compare where a surviving bot could run live.
Built something and want a second set of eyes on the walk forward results before you fund it? Send us the bot and we’ll look at the method, not the equity curve. And if you’re still picking a platform to run this on, start at AI Stock Trading Bots.
Stay alpha.
The FullStack Alpha research desk tests AI trading bots on paper and live accounts. Reviewed and edited by Jay Rocco, Founder and Editor.
