

The FullStack Alpha research desk tests AI trading bots on paper and live accounts. Reviewed and edited by Jay Rocco, Founder and Editor.
By FullStack Alpha Editorial Team | Reviewed by Jay Rocco, Chief Editor
The ORB strategy, short for opening range breakout, marks the high and low of the first few minutes after the open and trades a break of that range, with a stop on the other side. Does it work? It depends on what you trade and what you count. An academic paper on more than 7,000 US stocks reports large net returns from 2016 to 2023 when trading only “Stocks in Play,” a 10-year futures test from one creator reports mostly losses after costs, and two other creators show methods without costs or trade counts. The honest answer is that an ORB strategy is a testable idea, not a proven edge, and costs, the stock universe and the window size decide which side of zero you land on.
Key insights
- The paper’s headline: Zarattini, Barbon and Aziz report that a top-20 “Stocks in Play” 5-minute ORB portfolio returned over 1,600% net from 2016 to 2023, with a Sharpe ratio of 2.81, versus 198% for the S&P 500. The abstract says the benefit held “even after considering transaction costs.”
- One replication, one year: QuantConnect’s version on the 1,000 most liquid US stocks reported a 2.396 Sharpe for 2016 alone, and its research post does not state fees or slippage.
- Futures disagree: IRONCLAD Trading’s video reports a 10-year ORB test on ES, NQ, gold and euro futures with commissions and slippage, and three of the four markets lost money.
- No shared win rate: none of the sources gives a cost-adjusted win rate with a trade count you can compare, so ignore any single “ORB win rate” you see quoted.
- Your test decides: add costs first, hold out data, collect hundreds of trades and filter for the stocks the paper actually traded.
For the code side of testing and automating rules like these, see AI Stock Trading Bots.
What Is the ORB Strategy?
The ORB strategy is a rule for trading the first move of the day. You mark the high and low of a set window right after the open, then treat a break above or below that range as your signal.
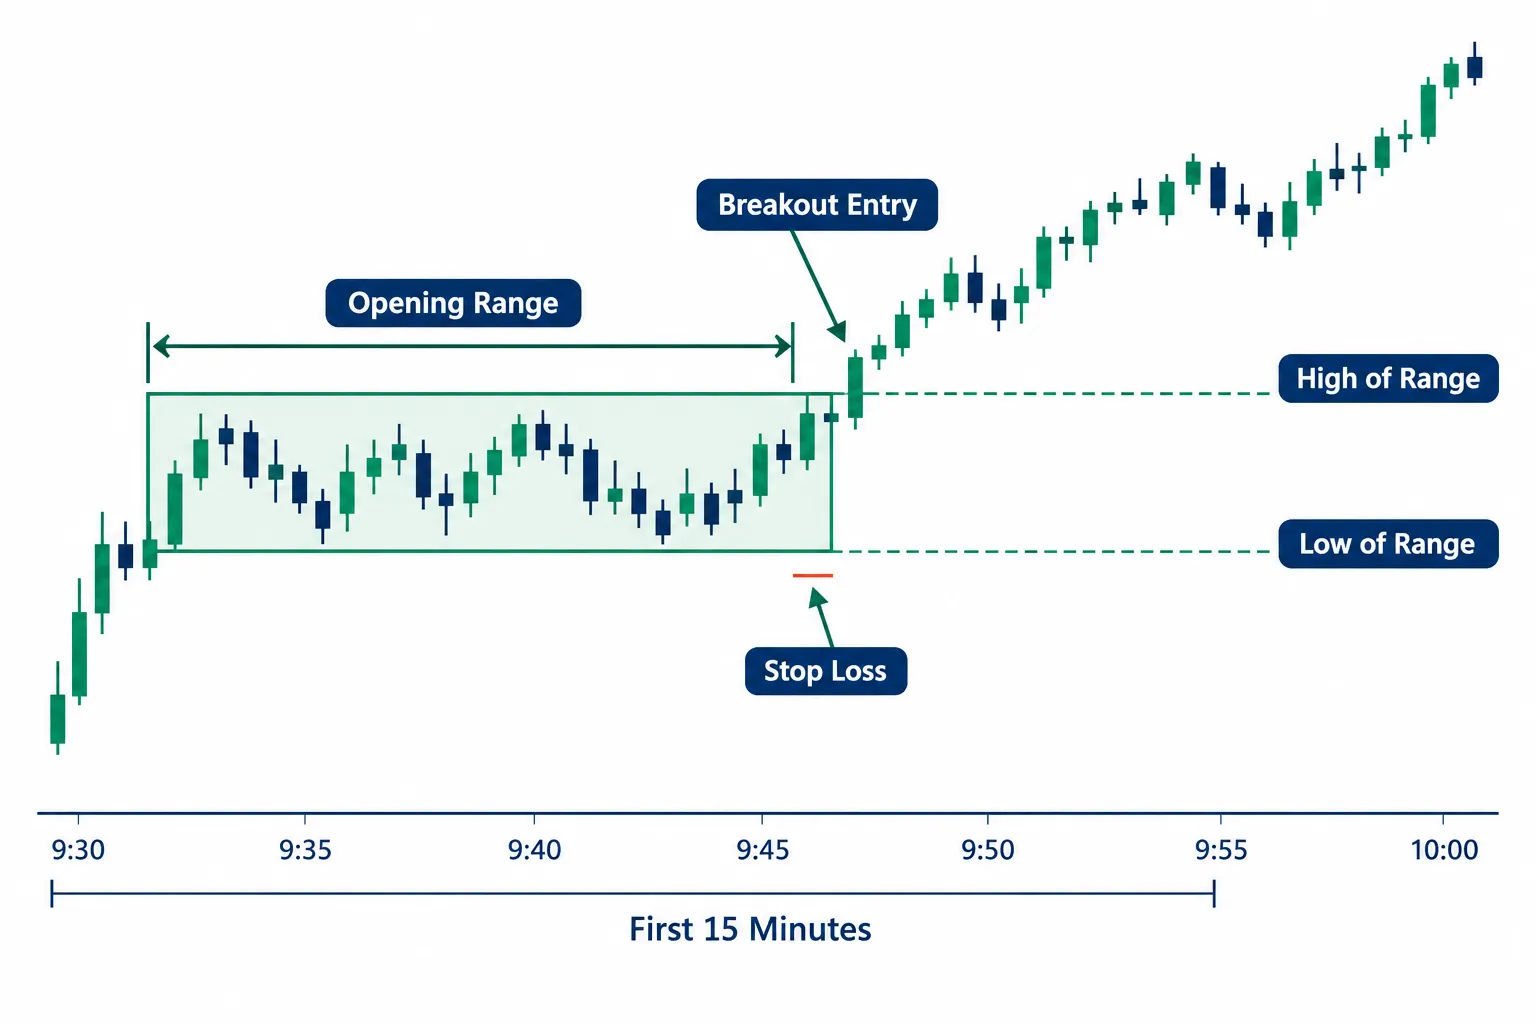
Think of it like a starting gate at a horse race. The gate opens, the horses jostle, and once one clears the pack you bet it keeps running. The opening range is the jostle. The breakout is the horse clearing the pack.
An opening range breakout has three pieces:
- The range. A fixed window after the open, commonly 5, 15, 30 or 60 minutes, defines a high and a low.
- The trigger. Price trading or closing above the high (long) or below the low (short).
- The risk plan. A stop, usually the other side of the range or a multiple of the stock’s average true range (ATR), and an exit, either a target or the close of the session.
That is the whole skeleton. Everything else, from which stocks to watch to which window to use, is where researchers and creators disagree. They disagree a lot, which is the point of this review.
How Does the 15 Minute ORB Strategy Work?
The 15-minute ORB strategy marks the high and low of the first 15 minutes of the regular session, then trades a confirmed break of either level with a stop on the opposite side.
The mechanical version, no indicators required:
- Mark the range. At 9:45 a.m. Eastern, note the highest and lowest prices traded since the 9:30 open.
- Wait for a break. Many traders require a candle close outside the range, not just a wick. A wick is noise. A close is a statement.
- Enter on confirmation. Long on a close above the range high, short on a close below the range low.
- Set a stop. The opposite end of the range, or the midpoint if the range is wide.
- Set an exit. A target of one times the risk (1R), a larger multiple, or a time stop at the close.
Illustrative example (made-up round numbers): a stock opens at $50.00. The first 15 minutes trade between $49.80 and $50.20, a 40-cent range. Price closes at $50.25, confirming the break. You enter at $50.25, stop at $49.80 (45 cents of risk), target $50.70 (1R). With $90 of planned risk you buy 200 shares. If it hits the target you make $90 before costs. If it hits the stop you lose $90 plus costs.
Now add costs. At one cent of slippage per share each way, 200 shares costs $4 per round trip, about 4% of the planned profit on a 1R winner. At three cents each way on a fast open, it is $12, or 13%. That is why the cost assumption, not the chart pattern, decides most ORB debates.
Is the ORB Strategy Profitable?
Profitability depends on which test you read, because the sources here land in different places. One reports large net returns on a filtered stock universe, one reports mostly losses on futures over a decade, and one public replication covers a single year without stated costs.
What does the academic paper report?
The paper is “A Profitable Day Trading Strategy For The U.S. Equity Market” by Carlo Zarattini (Concretum Group), Andrea Barbon (University of St. Gallen) and Andrew Aziz (Peak Capital Trading and Bear Bull Traders), published as Swiss Finance Institute Research Paper No. 24-98 and listed on SSRN. It was written in February 2024 and last revised in April 2025.
From the abstract: the authors tested ORB strategies, with a focus on the 5-minute ORB, on more than 7,000 US stocks from 2016 to 2023. Their key twist was trading only “Stocks in Play,” stocks showing higher than normal activity on a given day, mostly because of company news. They report a “significant benefit in limiting day trading only to those Stocks in Play (even after considering transaction costs).” A portfolio of the top 20 Stocks in Play achieved “a total net performance of over 1,600%, with a Sharpe ratio of 2.81, and an annualized alpha of 36%,” against 198% for passive S&P 500 exposure. The paper also compares 15, 30 and 60 minute windows.
Two cautions belong next to those numbers. We read the abstract, not the full cost model, so we cannot tell you how the authors priced slippage on thousands of fast-moving names. And one author is affiliated with a day trading education business. Neither point makes the result wrong. Both are reasons to test it yourself before trusting it.
What did the QuantConnect replication find?
QuantConnect published a replication of the Stocks in Play ORB with these rules:
- Universe: the 1,000 most liquid US stocks trading above $5, with ATR above $0.50, excluding SPY.
- Stocks in Play: the top 20 by relative volume, measured as first-5-minute volume today divided by the average first-5-minute volume over the prior 14 days.
- Entry at 9:35 a.m.: if the first 5-minute bar closed up, a buy stop at its high; if it closed down, a sell stop at its low.
- Stop based on entry price and 14-day ATR, sized so a stopped trade loses 1% of the capital allocated to that stock. Positions close at the session close.
Results for 2016, the first year of the paper’s window: a Sharpe ratio of 2.396 and a beta of -0.042, against 0.836 for buy-and-hold SPY. In a parameter sweep, 17 of 25 combinations beat the benchmark. The post does not mention fees, commissions or slippage, and commenters in the thread raise exactly that concern.
Our read: one year, no stated costs, and a strong result. Promising, not proof.
What did a 10-year futures test show?
IRONCLAD Trading’s video, embedded below, reports a 10-year ORB backtest on ES, NQ, gold and euro futures run in NinjaTrader with commissions and slippage included. The figures stated in the video: ES down 66%, NQ up 14%, gold down 50% and euro futures down 97%.
That is a decade, four instruments, and three of the four losing money. It is also a different universe from the paper: index and commodity futures, not news-driven single stocks.
Video by IRONCLAD Trading
The contrast with the paper is the lesson, not a contradiction to resolve. The paper’s edge comes from picking stocks with unusual news-driven activity. An index future has no Stocks in Play filter. Same pattern, different market, different result.
Why is a short or cost-free backtest weak proof?
A single profitable month is a coin that landed heads a few times in a row. Jesse Rogers presents a 15-minute version with fixed range volume profile levels, but the material reviewed for this piece shows no stated commissions, slippage or sample size. Without a trade count, you cannot tell whether the framework survived 20 trades or 200.
A small sample can look brilliant or terrible by chance alone. That is the single biggest reason creator backtests mislead well-meaning traders.
Which ORB Window Works Best, 5, 15 or 30 Minutes?
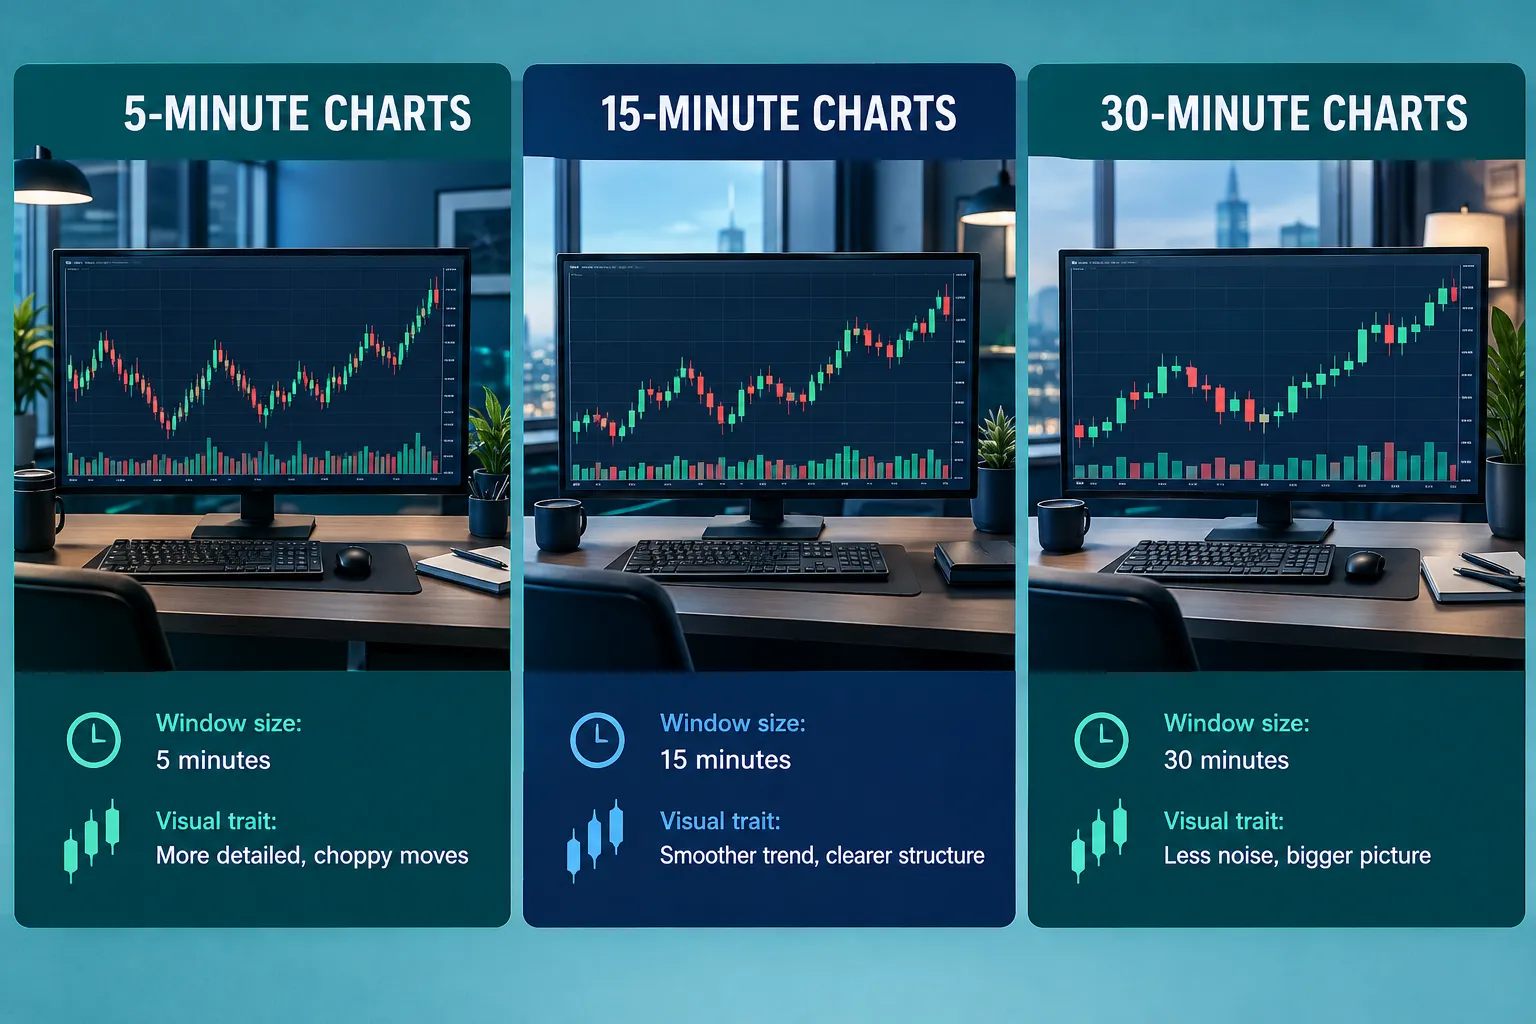
There is no single best window. Each source used a different one, so “best” depends on the market, the cost structure and the period you test.
- 5-minute window. The paper’s focus and QuantConnect’s replication. Strong reported results on Stocks in Play, but the shortest window also produces the most trades and the most exposure to opening slippage.
- 15-minute window. Jesse Rogers argues this window holds up best over time and layers in volume profile levels, without published costs or a sample size.
- Half-hour window. TheOneLanceB defines the range as roughly the first 30 minutes and trades the break once momentum confirms, a slower, more patient read of the open.
- 60-minute window. Included in the paper’s comparison of time frames.
A useful way to think about the trade-off: a shorter window gives you an earlier entry and a tighter range, so smaller risk per share but more false breaks. A longer window gives fewer, cleaner breaks but a wider stop and less of the day left to run. Neither is free.
Decision rule: pick the window your evidence supports for the market you trade, then test the neighbors (5 and 15, or 15 and 30) on the same data. If results collapse when you move the window by ten minutes, the edge is fragile.
What Is the Win Rate of an ORB Strategy?
None of the sources gives a cost-adjusted win rate with a trade count you can compare, and their markets and costs differ too much to average.
- Academic paper: the abstract reports return, Sharpe and alpha, not a headline win rate.
- QuantConnect replication: reports Sharpe and beta for 2016, not a win rate in the post.
- IRONCLAD Trading: the headline results are percentage returns by instrument over 10 years.
- Jesse Rogers and TheOneLanceB: no verified win rate or sample size; TheOneLanceB’s earnings claims are not treated as fact here.
That absence is itself a finding. Win rate also matters less than you think for this setup. An ORB strategy with a 1R target and a full-range stop needs to win more than half its trades after costs to make money. One that lets winners run to the close can make money at a 35% win rate if the average winner is large enough. Ask for win rate and average win to average loss together, or ignore both.
What Costs and Session Rules Change the Result?
Costs and session rules can turn a winning backtest into a losing one, because every layer you subtract from gross returns removes a little more of the illusion.
Think of it like a paycheck. Gross pay looks great until taxes and deductions come out:
- Gross result. The raw outcome before anything is subtracted, the number creators like to show first.
- Minus slippage. The gap between your intended and actual fill, which is worst in the first minutes after the open when everyone’s orders hit at once.
- Minus fees and commissions. Small per trade, large over hundreds of trades.
- Net result. What is left. The paper says its result holds after transaction costs; the QuantConnect post does not state costs; IRONCLAD says it included commissions and slippage.
Session rules matter too. A regular-hours stock test behaves differently from a futures test that includes the overnight session, because the “open” means something different. Stock ORB traders anchor to the 9:30 a.m. Eastern open. Futures trade nearly around the clock, so you have to choose which open you mean and test that choice.
The rulebook changed for small day traders in 2026 as well. FINRA Regulatory Notice 26-10 replaced the old pattern day trader rules, including the $25,000 minimum equity requirement, with new intraday margin standards effective June 4, 2026, and firms may phase them in through October 20, 2027. A small account that runs an ORB strategy every day should check how its broker has implemented the change before sizing positions.
How Did the 3 Creator Backtests Compare?
Here is the scorecard, built from the material reviewed for this piece. None of the three creators used the same years, markets or cost assumptions, so a direct ranking would mislead.
| Creator | Years Tested | Markets | Costs Shown | Sample Size | Our Read |
|---|---|---|---|---|---|
| IRONCLAD Trading | 10 years | ES, NQ, gold, euro futures | Yes, commissions and slippage | Not stated as a trade count, full decade run | Most rigorous of the three on costs, mostly negative results |
| Jesse Rogers | Not stated | Equities, 15-minute window | Not shown | Not shown | Useful framework, unverifiable as a standalone edge |
| TheOneLanceB | Not stated | Equities, roughly 30-minute window | Not shown | Not shown | Earnings claim unverified, treat as an idea to test, not a result |
IRONCLAD Trading ran the closest thing to a stress test in this group: a decade, four futures markets, and costs included. What it does not show is a breakdown by year or regime, so you cannot tell which stretches drove the losses.
Jesse Rogers builds a clear, repeatable 15-minute method with volume profile context and states a preference for that window over the long run. The method is clear. The costs, trade count and test period are not, so it reads as a starting point for your own testing.
TheOneLanceB presents a roughly 30-minute range with a momentum-confirmation entry, a reasonable, patient variation on the theme. His video title implies large earnings, which we could not verify and do not repeat as fact.
Set against the academic paper and the QuantConnect replication, the pattern is consistent: the one source that filters for Stocks in Play and claims to include costs reports strong results; the futures test with costs reports losses; the creator methods without costs cannot be scored.
How Do You Backtest an ORB Strategy Without Fooling Yourself?
Include realistic costs from the start, test on data the strategy never saw, and collect enough trades that the result is not noise.
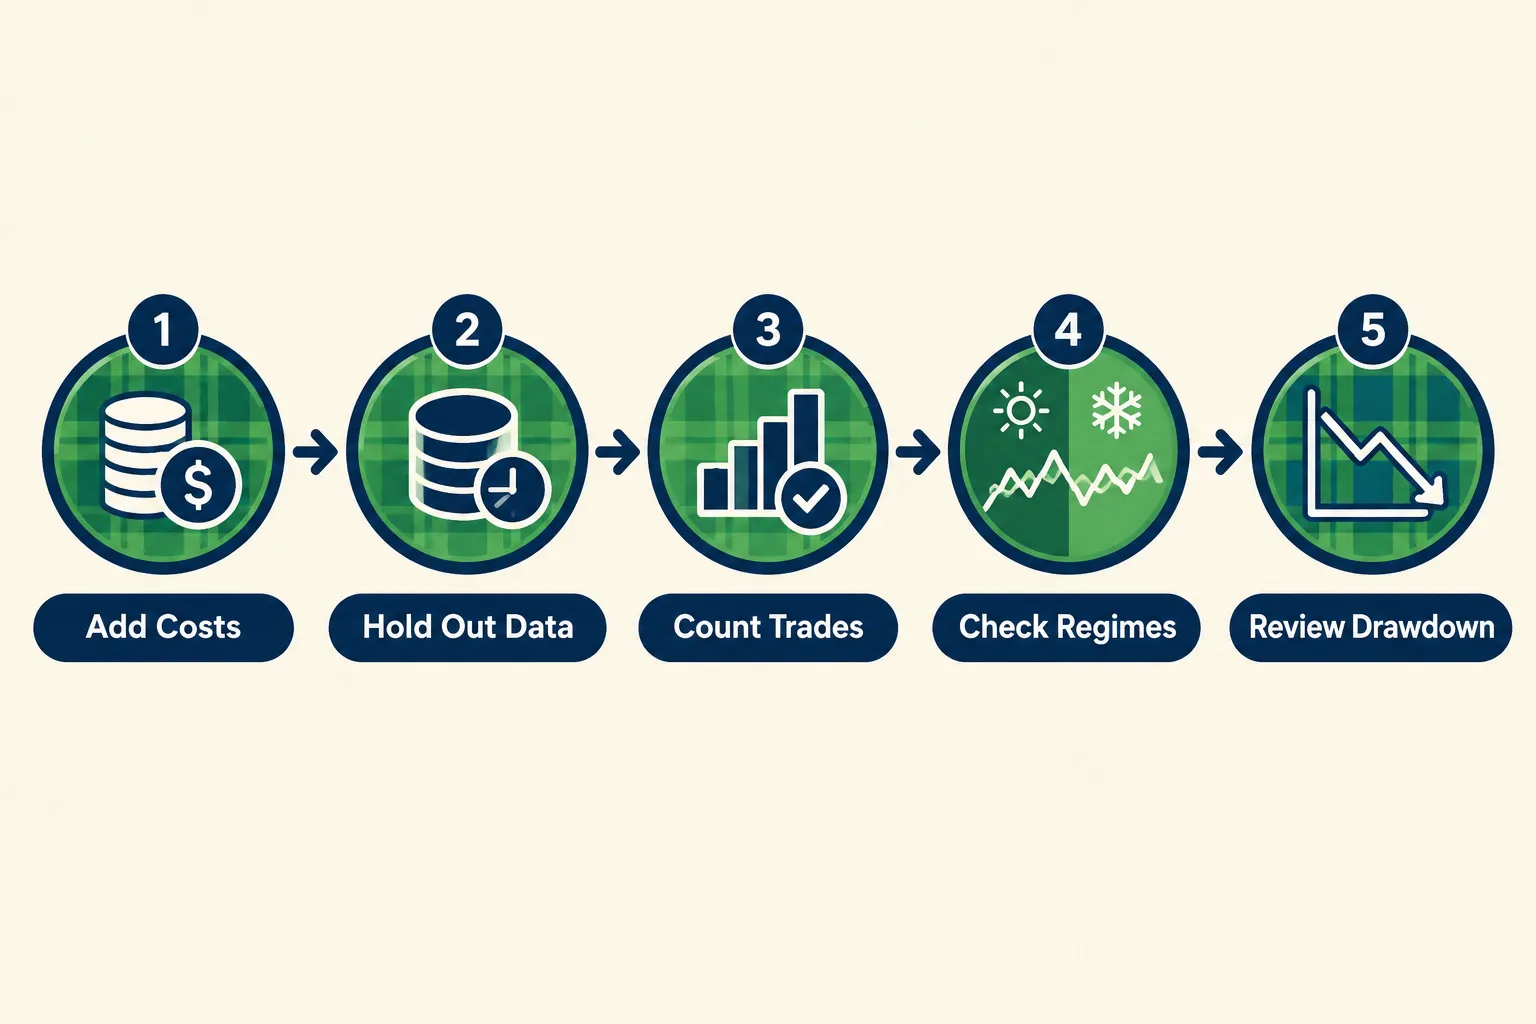
- Add costs first, not last. Bake slippage and commissions into every trade from day one. The first minutes after the open are the most expensive minutes of the day to trade. Our guide to paper trading slippage shows how to size a realistic haircut.
- Copy the universe, not just the pattern. The paper’s result comes from Stocks in Play. If you test an ORB on every stock, or on an index future, you are testing a different strategy.
- Hold out a period. Build your rules on one stretch of history, then test them unchanged on a later stretch. If the result falls apart, the original was overfit.
- Get enough trades. A 15-trade sample proves nothing. Aim for hundreds across different market conditions.
- Check the regime, not just the total. Split results by year. A strategy that made all its money in one volatile year is a bet on that year returning.
- Guard against look-ahead. A 5-minute range is only known after the 5-minute bar closes. Code that “enters at the high” using the finished bar’s data is cheating. Our explainer on look-ahead bias covers how to catch it.
If you build in TradingView, our Pine Script strategy guide shows how to turn the rules into a backtest, and our guide to backtesting TradingView strategies covers the settings that make the report honest. For futures, see the best backtesting software for futures. To replicate the stock version at scale, QuantConnect’s LEAN engine is where the public replication was built.
How Should You Size an ORB Strategy Trade?
Size from the stop, not from conviction. The QuantConnect replication uses the simplest sound rule: size each trade so that a stopped trade loses 1% of the capital allocated to it.
The formula is risk dollars divided by risk per share. On a $10,000 account risking 1%, your risk is $100. If the range is 40 cents and your stop is the other side of it, you can buy 250 shares. If the range is $1.20, you can buy 83. Wide ranges get small positions automatically.
Two practical limits:
- Cap the position value. A 5-cent range on a $100 stock would let a $100 risk budget buy 2,000 shares, a $200,000 position. Set a maximum position value so a tight range does not create a position your account cannot carry.
- Count the open. Slippage on a fast open can turn a 40-cent planned risk into 55 cents. If you see that pattern in your log, either widen your risk estimate or skip the first minute.
What Should You Log When You Paper Trade an Opening Range Breakout?
Log the parts of the trade a backtest assumes away. A forward test is only useful if it measures the gap between the plan and the fill, and the open is where that gap is widest.
| Column | Why it matters for this setup |
|---|---|
| Range high, low and width | Shows whether wide-range days behave differently from narrow ones |
| Relative volume at the trigger | Tests the Stocks in Play filter instead of trusting it |
| Trigger price vs fill price | Your real opening slippage, in cents and as a share of the range |
| Time from trigger to fill | Reveals data or order lag in the first minutes |
| Exit type | Target, stop or time exit, so you can see which one carries the results |
| News catalyst, yes or no | Checks whether your winners come from the same kind of day the paper traded |
| R result after costs | The only result that counts |
Run at least 50 trades before reading the log, because an opening breakout on a single stock can fire only a few times a week. Then sort by range width and by relative volume. If all your profit comes from the top quarter of relative volume, you have rediscovered the paper’s filter, and you should trade only those days. If the profit is spread evenly and thin, costs will probably erase it live.
What does a realistic first month look like?
Expect it to be messy. Watch for three patterns in particular: triggers on the most active names filling several cents past the level, losing trades clustering on unusually narrow ranges, and a time stop at the close doing more work than your target. None of those show up in a backtest summary, and each one changes how you size and filter. Your log tells you which ones apply to you.
Decision rule: move from paper to a small live account only when three things hold across 50 or more forward trades: average slippage is smaller than one tenth of the average range, results stay positive after your cost haircut, and you took every valid signal instead of picking favorites. Miss one and keep testing.
Can You Automate an ORB Strategy?
Yes. The rules (mark a range, trigger on a break, stop, exit) are mechanical enough to code without discretion, which is why so many traders try. The hard part is not the code. It is slippage, partial fills and data reliability at the open, which a backtest often glosses over.
Three automation risks specific to the ORB strategy:
- Everyone’s order lands at once. The opening minutes concentrate orders, so stop entries can fill well past the trigger.
- Data feeds lag at the open. A late bar can make your bot enter after the move. Log the bar close time against your order time.
- Stocks in Play need a scanner. The paper’s edge depends on finding unusual relative volume before the trade, which means your bot needs a reliable pre-trade filter, not just a chart rule.
NinjaTrader and TradingView both support this kind of rule-based execution; see our NinjaTrader tool profile for the futures route. Our guide on how to automate trading covers the options from alerts to full bots.
Frequently Asked Questions
What is the ORB strategy?
The ORB strategy, or opening range breakout, marks the high and low of the first few minutes after the open and trades a break of that range. A stop goes on the other side of the range, and the exit is a target or the session close. Common windows are 5, 15, 30 and 60 minutes.
Is the ORB strategy profitable?
It depends on the market and the filter. A 2024 paper by Zarattini, Barbon and Aziz reports over 1,600% net returns from 2016 to 2023 trading only news-driven Stocks in Play, while a creator’s 10-year futures test reports losses in three of four markets after costs. Test it on your own market with costs before trusting either.
What is the 15 minute ORB strategy?
The 15 minute ORB strategy marks the high and low of the first 15 minutes after the 9:30 a.m. Eastern open. A close above the high is a long signal and a close below the low is a short, with a stop at the other side of the range and a target or a time exit.
Which ORB window is best, 5, 15 or 30 minutes?
No source shows one window winning everywhere. The academic paper focuses on 5 minutes and also compares 15, 30 and 60. Shorter windows give tighter stops and more false breaks; longer windows give fewer, cleaner breaks with wider stops.
What is the win rate of an ORB strategy?
None of the sources reviewed publishes a cost-adjusted win rate with a trade count you can compare. Win rate also depends on the exit: a 1R target needs to win more than half the time after costs, while letting winners run to the close can work at a lower win rate.
How do you backtest an ORB strategy honestly?
Add slippage and commissions from the first trade, copy the stock universe of the study you are testing, hold out a later period, and collect hundreds of trades. Make sure the code only uses the opening range after that bar has closed, or the test is reading the future.
Can you automate an ORB strategy?
Yes, the rules are mechanical, and platforms such as NinjaTrader, TradingView and QuantConnect can run them. The hard parts are opening slippage, data lag in the first minutes and the pre-trade scanner needed to find Stocks in Play.
Our Take
Three creators, one academic paper, one replication, no agreement on a single number. The ORB strategy is a real, testable idea and not a scam, but “it works” depends on the market, the stock filter, the window and whether costs were subtracted before anyone declared victory. The strongest evidence, the Zarattini, Barbon and Aziz paper, works on news-driven Stocks in Play, not on any chart you happen to open. Treat every result here as a hypothesis: copy the universe, add costs first, hold out data, and paper trade it before money touches it.
Related: if you plan to run the stock version through a broker API, our Alpaca review on AI Stock Picker App is a practical next read.
Building your own ORB strategy and not sure your backtest holds up against real costs? Submit your bot for a real review and find out before the market does.
Stay alpha.
The FullStack Alpha research desk tests AI trading bots on paper and live accounts. Reviewed and edited by Jay Rocco, Founder and Editor.
