

The FullStack Alpha research desk tests AI trading bots on paper and live accounts. Reviewed and edited by Jay Rocco, Founder and Editor.
By FullStack Alpha Editorial Team | Reviewed by Jay Rocco, Chief Editor
Max drawdown is the biggest peak-to-trough drop in your account equity over a given period, measured as a percentage. For most retail trading bots, anything past 20% deserves a hard look, and past 30% you’re in territory where the math starts working against you. A 20% drawdown needs a 25% gain to get back to even. A 50% drawdown needs 100%. The deeper the hole, the more lopsided the climb out, which is why max drawdown matters more to your survival than any return number on a sales page.
What You Should Know
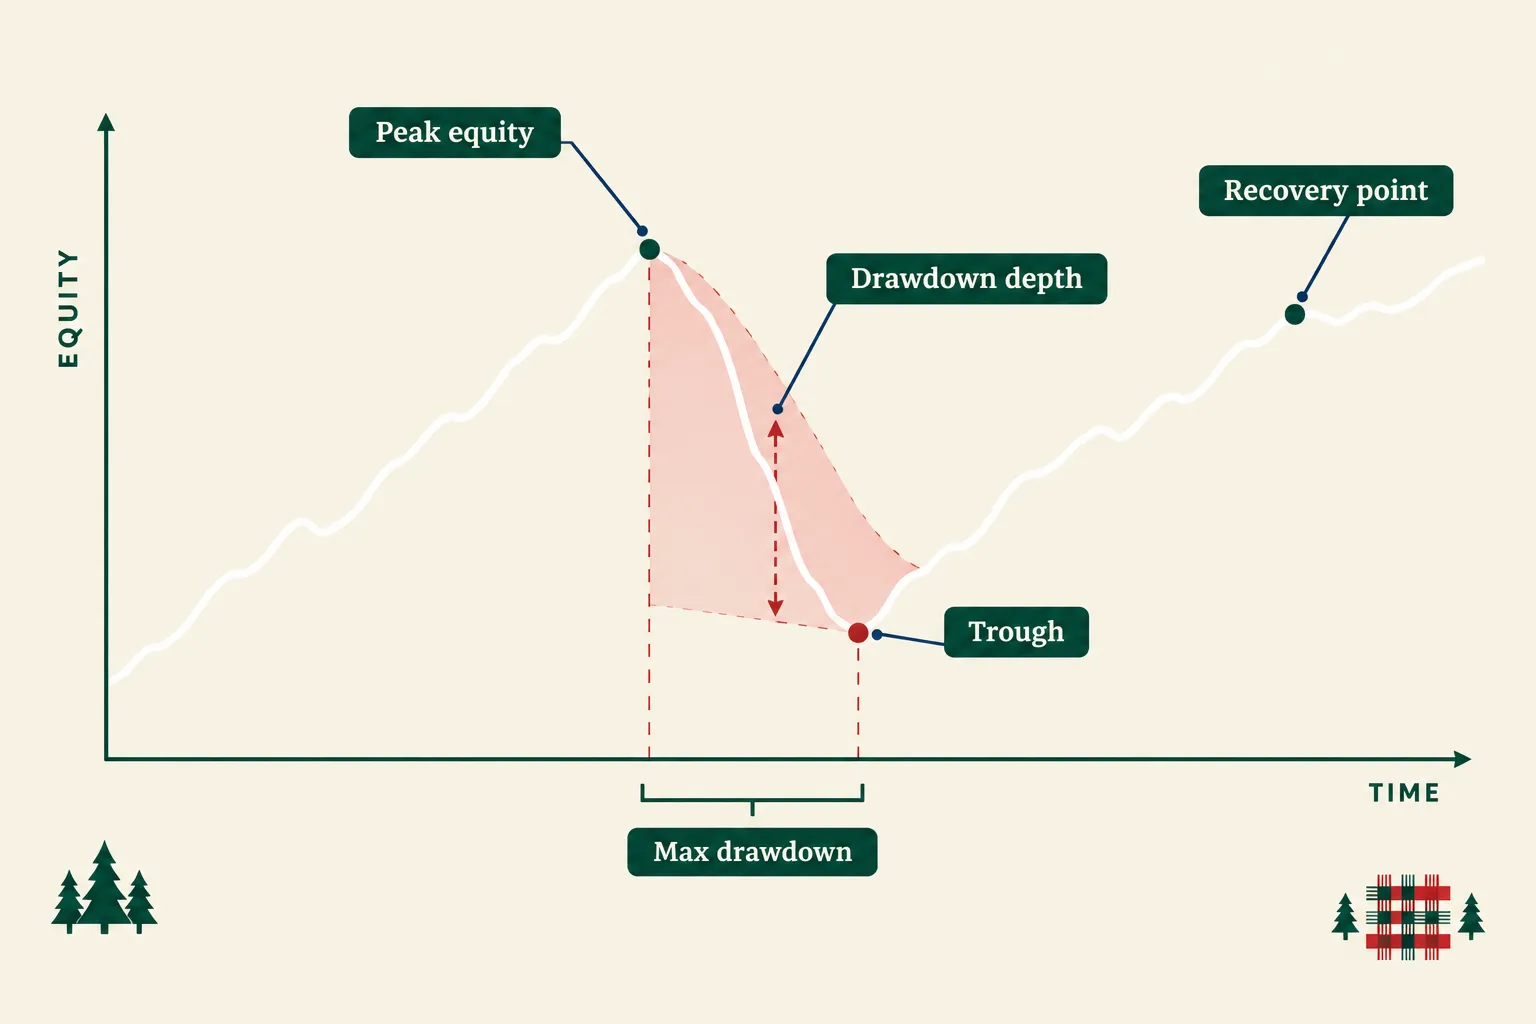
- Max drawdown measures the worst realized peak-to-trough equity decline over a test or live period, which ties it more directly to capital damage than volatility does.
- There is no universal “correct” number. A 30% maximum drawdown might be normal for a leveraged trend-following system and a disaster for a market-neutral bot.
- Regulators focus on control, not a fixed cap. ESMA’s February 2026 supervisory briefing on algorithmic trading in the EU requires that algo systems be testable and controllable, with periodic validation under MiFID II and RTS 6/7.
- MiFID II Article 17 requires firms running algorithmic trading to have thresholds, limits, monitoring, and business continuity arrangements that stop erroneous orders. No single percentage is prescribed.
- In the US, SEC Rule 15c3-5 requires broker-dealers with market access to block orders that exceed preset credit or capital thresholds. That’s a market-access control regime, not a retail bot drawdown cap.
- Platform changes count as risk events. Crypto bot platform 3Commas scheduled its V1 platform for deactivation on September 11, 2026, with users migrating to a V2 platform built with WunderTrading. Any migration of API keys, leverage settings, or safety orders should be revalidated before going live.
What Is Max Drawdown?
Max drawdown is the largest percentage drop from a peak in your account equity to the lowest point that follows, before a new peak is made. It answers one brutal question: what was the worst stretch this bot put me through?
The formula in plain words:
Take the highest equity value reached. Subtract the lowest equity value that came after it. Divide that difference by the peak. Multiply by 100.
So if a bot grew an account to $12,000, then sank to $9,600 before recovering, the drawdown is ($12,000 - $9,600) / $12,000 = 0.20, or 20%. If that’s the deepest dip in the whole record, that’s your maximum drawdown.
Two details people miss:
- It’s measured peak-to-trough, not start-to-end. A bot can finish the year up 18% and still have put you through a 34% hole in March. The final number lies. The curve doesn’t.
- It’s a realized sequence, not a probability. Max drawdown tells you what already happened. It does not promise that’s the worst that can happen. Future drawdowns routinely exceed historical ones.
Drawdown trading, in human terms
Drawdown trading is just the practice of building your rules around the dip rather than around the gain. Most retail traders size positions off the upside they want. Professionals size off the downside they can tolerate without quitting.
Think of it like a diet. Anyone can describe the body they want. The useful question is how many hungry Tuesdays you’ll actually put up with before you raid the pantry. Same with a bot. Your real max drawdown limit is the number at which you stop trusting the system and pull the plug at the worst possible moment.
Related terms worth separating
- Current drawdown: how far below the most recent peak you are right now.
- Average drawdown: the typical dip size, which is usually far smaller than the max.
- Drawdown duration: how long it took to get back to the old peak. This one wrecks more people than depth does. A 12% drawdown that lasts eight months feels worse than a 22% one that heals in three weeks.
- Maximum drawdown: the headline figure, the worst of them all.
Track all four. The max alone hides the shape of the pain.
What Is the Recovery Math After a Drawdown?
Losses and gains are not symmetric, and that asymmetry is the entire argument for keeping max drawdown tight. Lose 20% and you need 25% to get flat. Lose 50% and you need 100%. The formula: required gain = loss / (1 - loss).
Here’s the arithmetic, computed directly from that formula and rounded to one decimal:
| Drawdown | Equity left per $10,000 | Gain needed to recover |
|---|---|---|
| 5% | $9,500 | 5.3% |
| 10% | $9,000 | 11.1% |
| 15% | $8,500 | 17.6% |
| 20% | $8,000 | 25.0% |
| 25% | $7,500 | 33.3% |
| 30% | $7,000 | 42.9% |
| 35% | $6,500 | 53.8% |
| 40% | $6,000 | 66.7% |
| 50% | $5,000 | 100.0% |
| 60% | $4,000 | 150.0% |
| 70% | $3,000 | 233.3% |
| 80% | $2,000 | 400.0% |
| 90% | $1,000 | 900.0% |
Check a couple yourself. At 30%: 0.30 / 0.70 = 0.4286, so 42.9%. At 70%: 0.70 / 0.30 = 2.333, so 233.3%. The curve goes vertical fast.
The practical reading: the damage stays roughly linear until about 20%, then it starts compounding against you.
Why this breaks bots specifically
A discretionary trader in a 40% hole can go flat, take a week off, and come back with a smaller size. A bot has no such instinct. It keeps firing the same setup at the same size into the same conditions that just took 40%, because that’s what you told it to do.
Worse, many bots size positions as a percentage of current equity. After a 40% drawdown, every trade is 40% smaller in dollar terms. The engine that dug the hole has lost 40% of its shovel power on the way out. Recovery takes longer than the table suggests.
Time is the hidden cost
Say a bot averages 1.5% a month when things go well. Climbing out of a 42.9% required gain at that pace takes roughly 24 months of uninterrupted good conditions. Two years of your capital doing nothing but repairing a single bad stretch. That’s the real price of a deep max drawdown, and no backtest report puts it in bold.
Decision rule: before you deploy, look at the backtest’s worst drawdown, then calculate the recovery gain and divide by the bot’s average monthly return. If the answer is more months than you’d willingly wait, the bot is too big for your account. Shrink it.
How Much Max Drawdown Is Too Much for a Trading Bot?
For most self-directed retail traders, a max drawdown above 20% is the point where you should either cut position size or shut the bot down. Above 30%, the recovery math and the psychology both turn against you. Below 10% is comfortable but often means you’re under-deployed.
These are thresholds you set, not industry commandments. A strategy-dependent frame that actually works:
- Under 10%: conservative for many systematic strategies. Fine for market-neutral, mean-reversion, or income-style bots where steady is the whole point.
- 10 to 15%: generally manageable when returns, liquidity, and recovery behavior all look healthy. This is a sensible target band for a first automated system.
- 15 to 25%: acceptable for directional or trend-following bots that accept long losing streaks in exchange for fat winners. You need to have agreed to this in advance, in writing.
- Above 30%: only defensible if you knew it going in, the account is small enough that the dollar loss doesn’t change your life, and the strategy has a structural reason for the depth.
Set it by account size, not by vibes
| Account size | Suggested max drawdown ceiling | Dollar pain at the ceiling | Why |
|---|---|---|---|
| $2,000 to $5,000 | 10 to 15% | $200 to $750 | Small accounts can’t afford long repair cycles. Fees and slippage already eat a bigger share. |
| $5,000 to $25,000 | 15 to 20% | $750 to $5,000 | Enough room to let a strategy breathe without the dollar loss becoming a life event. |
| $25,000 to $100,000 | 12 to 18% | $3,000 to $18,000 | Dollar amounts get real. Most people discover their true tolerance here. |
| $100,000+ | 8 to 15% | $8,000 to $15,000+ | Capital preservation dominates. Recovery time matters more than upside. |
Note the pattern: the ceiling tightens as the account grows, because the dollar figure is what you feel. A 25% drawdown on $3,000 is an annoying weekend. A 25% drawdown on $180,000 is $45,000 and a very quiet dinner.
The dollar test beats the percentage test
Percentages are abstract. Write down the dollar figure instead.
Ask: if this bot lost $X tomorrow and stayed there for six months, would I still run it? If the honest answer is no, your max drawdown limit is lower than $X. Set it there and size the bot to match.
A common mistake: traders pick 20% because it sounds professional, then panic and kill the bot at 11% because no one ever converted 20% into a number with a dollar sign. Do the conversion first.
Is 20% max drawdown too much risk?
For a leveraged futures trend-follower, 20% is normal and on the tight side. For a covered-call income bot sold on the promise of steady monthly cash flow, 20% means the strategy isn’t doing what the marketing said.
So the question isn’t whether 20% is too much. It’s whether 20% matches what you were sold. When a tool advertises “consistent, low-volatility returns” and the backtest shows a 23% maximum drawdown, the mismatch is the finding. We dig into that gap in our breakdown of which AI trading bots are legitimate versus scams.
How Do Prop Firm Drawdown Rules Change the Answer?
Prop firms hand you the max drawdown limit instead of letting you choose it, and breaching it usually ends the account immediately. That shifts the whole exercise from “what can I tolerate” to “what will survive someone else’s rulebook.”
Two structures dominate, and they behave very differently.
Static versus trailing drawdown
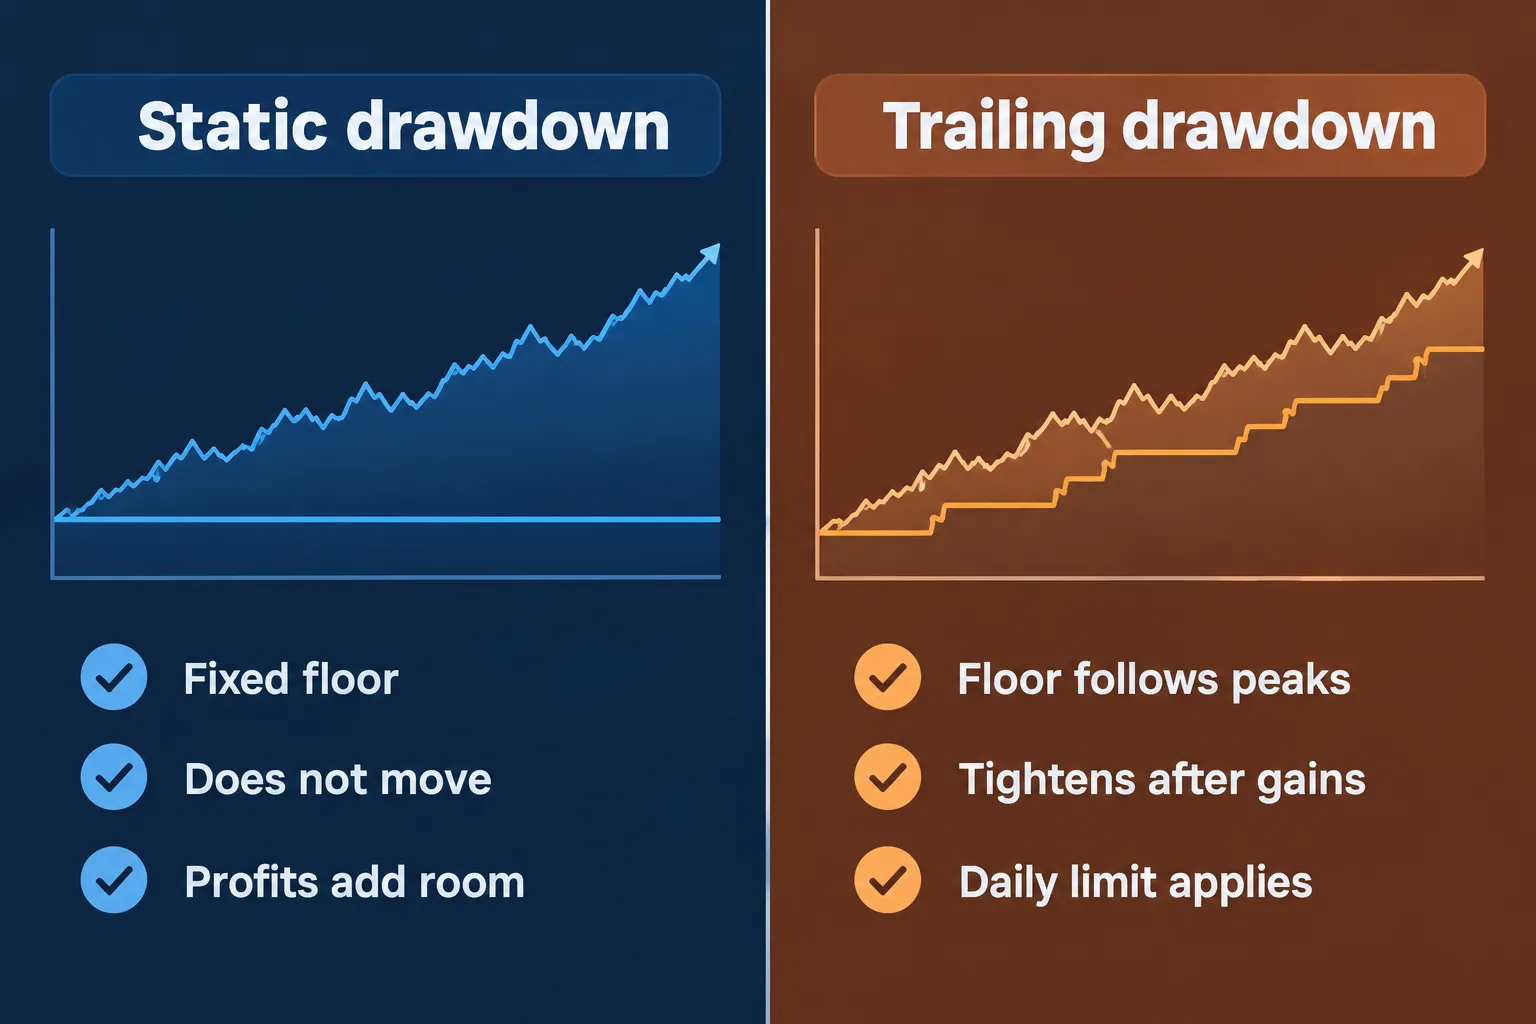
Static (or absolute) drawdown sets a fixed floor based on your starting balance. If the floor is set at a given percentage below your initial capital, it stays there no matter how much you make. Profits build cushion above an unmoving line. Easier to trade, easier to model.
Trailing drawdown moves the floor up as your equity makes new highs. Make money and the loss limit follows you. Some firms trail off closed balance, some off intraday high-water mark, which is a meaningful difference. Intraday trailing can breach you on an unrealized dip that your bot later recovers from.
| Feature | Static drawdown | Trailing drawdown |
|---|---|---|
| Floor behavior | Fixed at the start | Rises with new equity peaks |
| Effect of profits | Adds permanent cushion | Tightens the leash |
| Bot friendliness | Simpler to code and model | Needs a live-updating floor variable |
| Worst-case surprise | Predictable | Breach after a good run, on a normal pullback |
Daily loss limits are the other trap
Most funded programs stack a daily loss limit on top of the overall drawdown cap. You can be well inside your total allowance and still get flagged for a single bad session. A bot that averages fine across a month but occasionally has a 4% day will fail a 3% daily limit eventually. Guaranteed by frequency, not by bad luck.
Rules change often and vary by account type and firm. Do not take a Reddit screenshot as policy. Check the official page of whichever firm you’re evaluating, read the exact wording on whether the trail is based on closed balance or intraday equity, and confirm the daily limit resets time in your broker’s timezone.
How to configure a bot for a funded account
- Pull the exact drawdown rule and daily limit from the firm’s official rules page.
- Set your bot’s internal halt at 70% of the stated limit. If the firm allows a 6% total drawdown, your bot stops at roughly 4.2%. The buffer absorbs slippage and commission that the rules don’t forgive.
- Code the daily halt separately. One trigger for the day, one for the account.
- Test the halt logic in simulation before funding. Not the strategy, the halt. That’s the part that saves the account.
Running a bot inside someone else’s risk rules is a different sport from running one in your own brokerage account. Compare the execution and automation options in our rundown of fully automated AI trading bots before committing capital to either.
How Does Max Drawdown Relate to Profit Factor and Expectancy?
Max drawdown tells you how bad it got. Profit factor and expectancy tell you whether the system has any business being deployed at all. You need all three, because a bot can have a lovely profit factor and still put you through a drawdown you’d never sit through.
Profit factor trading math: gross profit divided by gross loss. Above 1.0 means the system made money. Around 1.5 is respectable. Above 2.5 in a backtest usually means you’ve overfit something or forgotten to include costs.
Expectancy trading math: the average dollar result per trade. (Win rate x average win) minus (loss rate x average loss). A positive expectancy with enough trades is the only thing that makes a system worth automating.
A small worked comparison
Three hypothetical bots, 100 trades each, to show how the numbers interact:
| Bot A | Bot B | Bot C | |
|---|---|---|---|
| Win rate | 65% | 40% | 55% |
| Average win | $120 | $400 | $150 |
| Average loss | $200 | $150 | $160 |
| Gross profit | $7,800 | $16,000 | $8,250 |
| Gross loss | $7,000 | $9,000 | $7,200 |
| Profit factor | 1.11 | 1.78 | 1.15 |
| Expectancy per trade | $8.00 | $70.00 | $10.50 |
| Longest losing streak | 4 | 11 | 5 |
| Likely max drawdown character | Shallow, frequent | Deep, infrequent | Shallow, frequent |
Bot B is the best system by every profitability measure and the hardest one to run. Eleven losses in a row at $150 each is $1,650 of straight bleeding before a winner shows up. On a $5,000 account that’s a 33% hole, and most people quit at trade seven.
The relationship in one line: profit factor and expectancy tell you if the edge is real, max drawdown tells you if you’ll still be in the chair when the edge pays off.
The streak math no one runs
With a 40% win rate, the chance of losing 11 in a row at some point over 500 trades is not small. Multiply your largest expected losing streak by your average loss and compare that number to your account. That’s your realistic drawdown floor, before any correlation or regime shift makes it worse.
Common mistake: optimizing a bot until profit factor hits 3.0 in a backtest, then being shocked when live drawdown triples. Most of that profit factor was curve fit. Our guide on avoiding look-ahead bias in backtesting covers how that creeps in without you noticing.
How Do You Measure Max Drawdown in a Backtest?
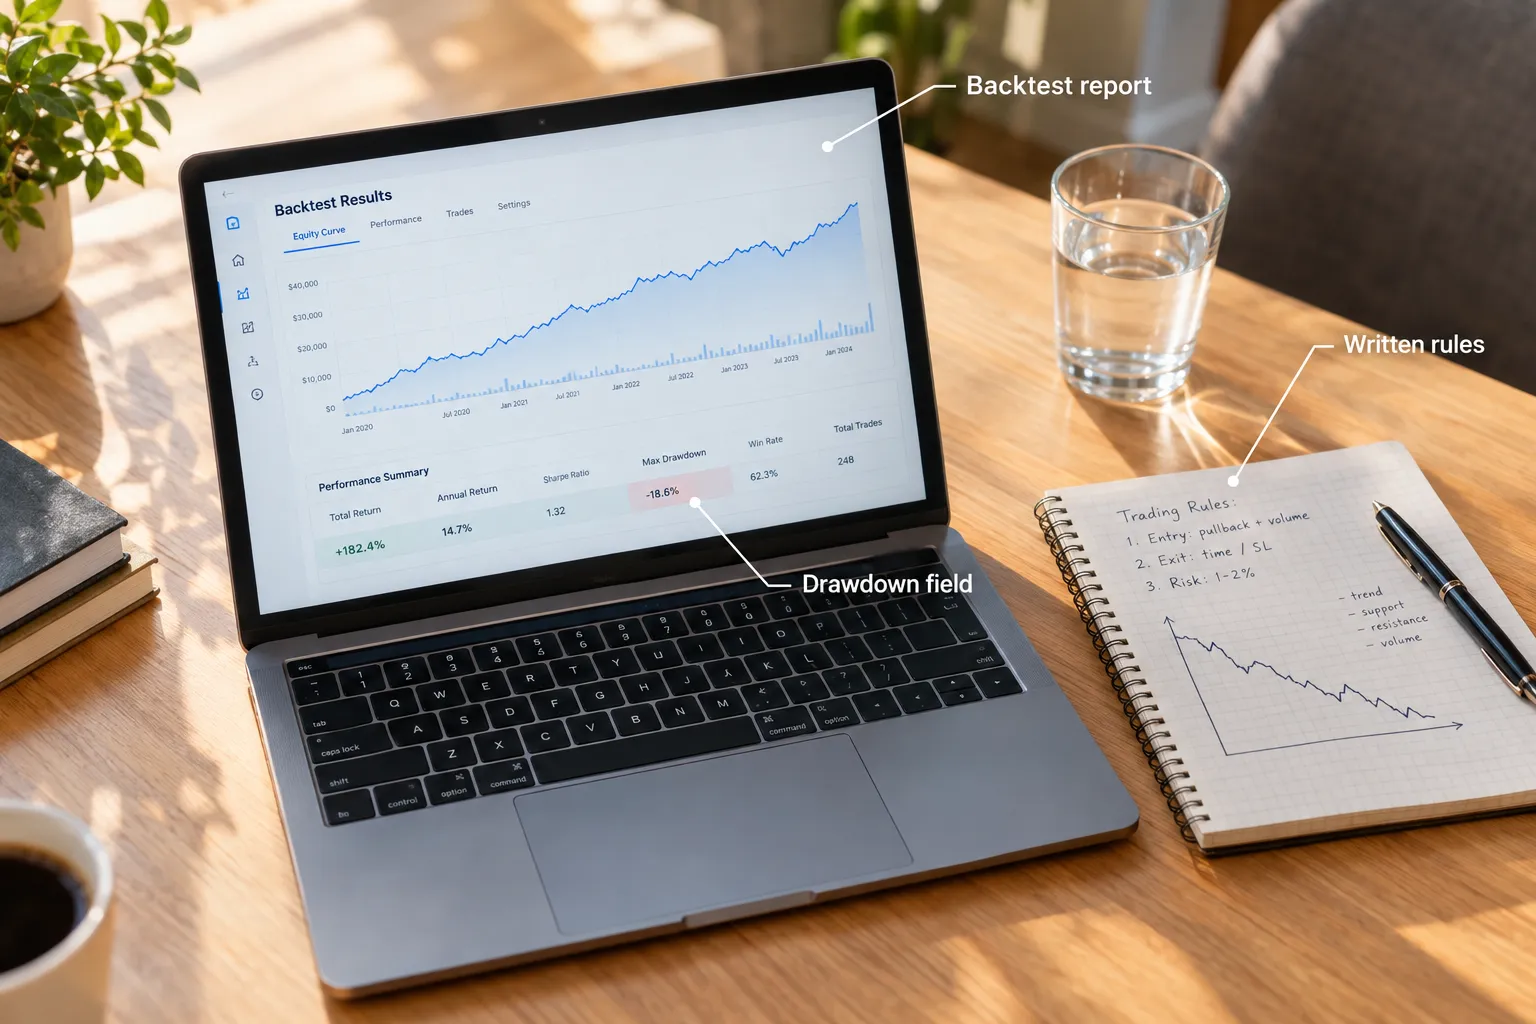
Most backtesting platforms compute max drawdown for you, so the job is finding the field and then deciding whether to trust it. TradingView’s Strategy Tester reports it in the Performance Summary, and the platform’s documentation describes it as the greatest decline in equity from a peak to a subsequent trough, shown in both currency and percentage terms. Verify the exact field label against TradingView’s current Strategy Tester documentation, since the interface has changed across versions.
Steps to get a number you can use
- Set a realistic starting capital. Default values of $100,000 flatter small-account strategies by hiding the effect of fixed costs and minimum position sizes.
- Enter commission and slippage. A bot that trades 40 times a week can turn a 12% max drawdown into a 19% one on costs alone. Blank cost fields are the single most common reason backtests lie.
- Run across at least two different market regimes. A bot tested only on 2023 to 2025 has never met a real bear market. Include a choppy, directionless period.
- Read the equity curve, not just the summary number. Look at how often the curve makes new highs. A bot with a 14% max drawdown that spent nine months underwater is worse than one with 19% that recovered in five weeks.
- Record drawdown duration separately. Most platforms don’t display it prominently. Measure peak date to recovery date yourself.
- Re-run with different start dates. Shift the start by three months, six months, nine months. If max drawdown swings from 11% to 28%, your result was an accident of timing, not a property of the strategy.
Verify the number against a forward test
Backtested drawdown is almost always optimistic. Paper trade or run a small live allocation for at least 30 to 60 trades before scaling up, and compare realized slippage against your assumptions. The gap between the two is usually where the extra drawdown comes from, which we break down in our piece on paper trading slippage.
If you need a testing environment, the options range from free to institutional. Start with the free backtesting software roundup or, for contracts, the futures backtesting software comparison.
Why did your bot’s drawdown suddenly spike?
A drawdown that jumps well past its backtested maximum almost always has one of six causes:
- Regime change. The bot was built for trending markets and the tape went choppy. Mean-reversion bots die in trends, trend bots die in ranges.
- Correlation collapse. You thought you ran five uncorrelated strategies. During stress they all became one trade.
- Leverage creep. Position sizing as a percent of equity grows the dollar risk as the account grows, until one bad week undoes six good months.
- Execution drift. Spreads widened, fills got worse, or your VPS added latency. The strategy didn’t change, its costs did.
- A platform or API migration. Settings do not always carry across cleanly. Treat any migration as a fresh operational risk and revalidate leverage, safety orders, and keys before going live.
- The backtest was wrong. Overfitting, survivorship bias, or look-ahead bias flattered the original number.
Decision rule: if live max drawdown exceeds backtested max drawdown by more than 50%, stop the bot and re-validate. Don’t wait to see if it heals.
How Do You Set a Drawdown Stop for a Bot?
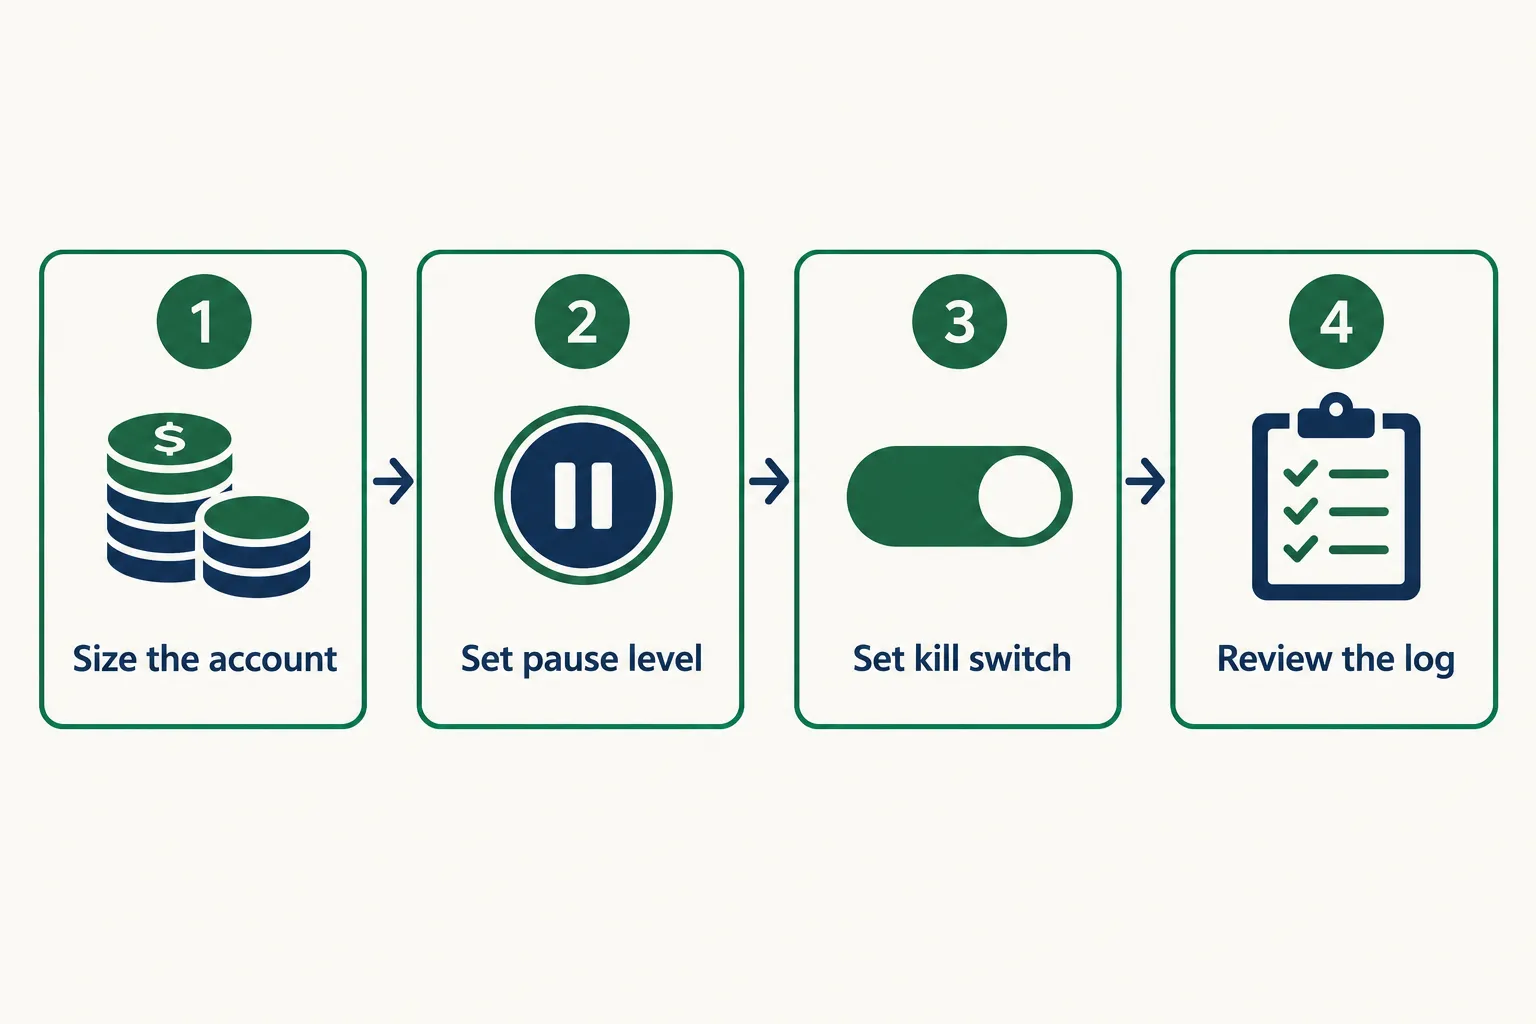
Set a two-tier limit: a soft pause level where the bot cuts position size, and a hard kill-switch where it flattens and stops trading entirely until a human reviews it. Write both numbers down before deployment, not during a losing streak.
A rule that holds up for most retail accounts:
- Soft pause at 10% below peak equity. The bot halves position size and keeps running. You gather data without bleeding at full speed.
- Hard stop at 18 to 20% below peak equity. All positions closed, bot disabled, no auto-restart. A human decides what happens next.
- Daily circuit breaker at 4% of account equity. One rough session shouldn’t become a weeklong spiral.
Building the kill switch
The kill switch is the one piece of code worth writing carefully, because it’s the only part that protects you when everything else is wrong.
- Track a running high-water mark of account equity, updated on every closed trade.
- On each cycle, compute current drawdown: (high-water mark minus current equity) / high-water mark.
- If that value crosses your soft threshold, reduce the size multiplier.
- If it crosses the hard threshold, cancel open orders, close positions, write a timestamped log entry, and set a flag that blocks new entries.
- Require manual re-enablement. No automatic reset at midnight. The friction is the feature.
- Send yourself an alert. Email, SMS, Telegram, whatever you read.
Broker and platform tooling increasingly supports this directly. Quote.Trade announced Quote.Trade Pro on October 22, 2026, adding limit orders, stop-losses, trailing stops, OCO and bracket orders, and trigger-based strategies accessible to humans, bots, and AI agents via Telegram. Bybit expanded its AI-assisted interface in September 2026 with liquidation-risk assessment and take-profit and stop-loss placement. Useful plumbing, but neither removes model risk or execution risk. Account-level drawdown control stays your job.
Should you stop trading when you hit max drawdown?
Yes, and that’s the whole point of setting the number. A limit you talk yourself out of isn’t a limit, it’s a suggestion with better branding. Play stupid games, win stupid prizes.
Stopping doesn’t mean quitting forever. It means: flat, bot off, 48-hour cooling period, then a written review covering whether the strategy broke, the market changed, or the execution degraded. Restart only when you can name the cause.
Can your max drawdown limit be too strict?
Absolutely. A limit tighter than the strategy’s natural variation will stop you out of a perfectly healthy system during a routine dip. That’s getting stopped out at the account level instead of the trade level, and it’s just as expensive.
The test: take the backtested maximum drawdown and multiply by 1.5. If your account-level limit is below that number, you will almost certainly halt a working bot. Either widen the limit or cut position size so the strategy’s natural drawdown fits inside your ceiling. The second option is almost always correct.
A bot with a 15% backtested max drawdown run at half size has a roughly 7.5% expected drawdown. Same edge, half the pain, and now your 12% kill-switch gives it room to breathe.
Does max drawdown still matter if the bot recovers?
Yes. Three reasons:
- You might not be there for the recovery. Most people pull capital near the bottom. The strategy’s recovery is irrelevant if your money left before it happened.
- Recovery consumed time you can’t get back. Months spent getting back to even are months not compounding.
- A deep drawdown is a sample of the tail. It proves the strategy can go that deep. Next time might be deeper, and your bankroll decides whether that’s survivable.
A bot that recovered from 45% isn’t proven resilient. It’s proven capable of a 45% hole.
What Are the Alternatives to Max Drawdown for Measuring Bot Risk?
Max drawdown is the most intuitive risk measure but not the most complete. Pair it with two or three others and you’ll catch problems a single number hides.
| Metric | What it measures | Best used for | Weakness |
|---|---|---|---|
| Max drawdown | Worst peak-to-trough equity loss | Survival and position sizing | Single historical observation, says nothing about frequency |
| Sharpe ratio | Return per unit of total volatility | Comparing strategies of different return profiles | Penalizes upside volatility as if it were risk |
| Sortino ratio | Return per unit of downside volatility only | Strategies with big asymmetric winners | Still averages, still hides the worst sequence |
| Calmar ratio | Annual return divided by max drawdown | Direct return-per-unit-of-pain comparison | Dominated by one historical event |
| Ulcer index | Depth and duration of drawdowns combined | Capturing how long you stayed underwater | Less familiar, fewer platforms report it |
| Average drawdown | Typical dip size | Understanding normal operating range | Hides the tail entirely |
| Drawdown duration | Time from peak to new peak | Judging whether you’d hold on | Not reported by default on most platforms |
Max drawdown versus Sharpe ratio: which matters more?
For a retail trader deciding whether to run a bot with real money, max drawdown matters more. Sharpe ratio is a comparison tool for choosing between strategies. Max drawdown is a survival tool for sizing the one you picked.
Sharpe treats a smooth 2% monthly gain and a lumpy one identically in the numerator while punishing the lumpy one in the denominator, even when the lumps are upside. A trend-following bot with great long-term results can post a mediocre Sharpe and still be the right choice for someone who can stomach the dips.
Use Sharpe to shortlist. Use max drawdown to size. Use Calmar to sanity-check that the return is worth the pain.
Common mistakes setting drawdown limits
- Setting the limit after deployment. The number you choose while down 14% is not a risk limit, it’s a hope.
- Using percentages without converting to dollars. Your brain doesn’t feel percentages.
- Copying someone else’s number. A limit tuned to a $200,000 account means nothing on $4,000.
- Ignoring drawdown duration. Depth gets the headline, time does the damage.
- Measuring drawdown on one bot while running five. Portfolio drawdown is what hits your account. Measure at the account level.
- Letting the bot auto-restart after a breach. The halt exists to force a human decision.
- Forgetting fees and slippage in the backtest. Free money in the model, real losses in the account.
- Counting unrealized gains in the high-water mark. Open-profit peaks create phantom drawdowns and premature halts. Pick closed equity or mark-to-market and be consistent.
Does Max Drawdown Work the Same Way for All Bot Types?
No. The same percentage means something different depending on what the bot is doing, how it’s financed, and how fast it trades.
- Grid and martingale bots: drawdown accumulates quietly in unrealized losses and then arrives all at once. A grid bot can show a tiny realized drawdown right up until the grid breaks, then post a catastrophic one. Measure these on mark-to-market equity, never on closed trades alone.
- Trend-following bots: long shallow drawdowns from accumulated small losses, punctuated by large wins. Drawdown duration is the metric that matters here, more than depth.
- Mean-reversion bots: high win rates with rare, deep losses. Backtested max drawdown chronically understates the risk because the true tail event may not be in your sample.
- Market-neutral and arbitrage bots: should show small drawdowns by design. A 20% maximum drawdown on a market-neutral bot means the neutrality assumption failed. That’s a structural problem, not a bad month.
- Options income bots: similar profile to mean-reversion. Steady premium collection, then one gap that eats a year of income. Measure drawdown against the worst historical gap, not the average month.
- Leveraged futures bots: drawdown and margin call risk are different thresholds, and the margin call usually arrives first. Model both.
Decision rule: match the metric to the shape. Grid bots need mark-to-market drawdown. Trend bots need duration. Market-neutral bots need a hard, low ceiling because exceeding it signals a broken assumption rather than variance.
If you’re still choosing what to run, the head-to-head AI trading tool comparisons for 2026 cover which categories disclose drawdown honestly and which bury it.
How Do Professional Traders Set Their Max Drawdown Limits?
Professionals set drawdown limits before capital is allocated, tier them, and enforce them with people who aren’t the strategy’s author. The percentage is a consequence of the process, not the starting point.
Common patterns worth copying at retail scale:
- Tiered responses, not a single cliff. A warning level, a size-reduction level, and a stop level. Risk gets dialed down gradually.
- Risk budget per strategy. Each bot gets an allocation that can be lost without threatening the account. The allocation, not the strategy, defines the max drawdown exposure.
- Enforcement is automated and external. Not a note in a spreadsheet. A system that acts without asking.
- Periodic validation. ESMA’s 2026 supervisory briefing emphasizes that algorithmic systems must be testable and controllable with periodic validation. That principle applies whether or not you’re a regulated firm.
- Documented pre-deployment thresholds. MiFID II Article 17 requires firms running algos to have appropriate trading thresholds and limits plus monitoring and business continuity arrangements. Retail traders aren’t bound by it, but the structure is free to borrow.
- Post-mortems on every breach. What broke, what changed, what gets fixed before restart.
Regulators are not prescribing a single number. SEC Rule 15c3-5 requires broker-dealers with market access to maintain controls preventing orders beyond preset credit or capital thresholds and to reject erroneous orders, which is a market-access regime rather than a universal drawdown cap for every retail strategy. The CFTC scheduled a Frontier Forum session on AI and agentic finance for October 28, 2026, which suggests the conversation is moving toward how autonomous systems get supervised, not toward a fixed percentage.
The takeaway for retail: no one is going to hand you a number. Controllability is the standard. Build the control.
Frequently Asked Questions
What is meant by max drawdown?
Max drawdown is the largest percentage decline in account equity from a peak to the lowest point that follows, before a new peak is reached. It measures the worst losing stretch over a given period. It’s reported as a percentage of the peak and is the most direct measure of how much capital a strategy destroyed at its worst, which makes it more useful than volatility for judging survival.
What is the formula for drawdown?
Drawdown = (peak equity minus trough equity) divided by peak equity, times 100. Maximum drawdown is the largest value that formula produces across the whole measurement period. The recovery side uses a separate formula: required gain = loss / (1 - loss). So a 25% drawdown needs 0.25 / 0.75 = 33.3% to get back to break-even.
How much drawdown is acceptable?
Under 10% is conservative for most systematic strategies, 10 to 15% is generally manageable when returns and recovery behavior are strong, and above 30% is hard to justify for a retail account. There is no universal threshold. A 30% drawdown may be normal for a leveraged trend-following bot and a failure for a market-neutral one.
What is a good profit factor?
Profit factor above 1.0 means the system made money, and roughly 1.5 to 2.0 is a healthy live range. Anything above 2.5 in a backtest should be treated as suspicious until a forward test confirms it, because that level usually comes from curve fitting or from leaving commission and slippage out of the model.
What is a trailing drawdown?
A trailing drawdown is a loss limit that moves upward as your account equity makes new highs, common in prop firm funded accounts. Unlike a static drawdown anchored to your starting balance, a trailing limit tightens after profitable runs. Some firms trail off closed balance and others off intraday equity, which produces very different outcomes. Check the firm’s official rules page for the exact method.
Should I stop trading if my bot hits its max drawdown limit?
Yes. Flatten positions, disable the bot, wait at least 48 hours, and write a review identifying whether the strategy broke, the market regime shifted, or execution costs degraded. Restart only after you can name the cause and have adjusted position size accordingly. A limit you override isn’t a limit.
Our Take
Size the bot to survive its worst historical max drawdown, then double that number and ask whether you’d still be here. If the answer is no, cut the position size until it’s yes. That’s the whole discipline. Most bots don’t kill accounts because the strategy was wrong, they kill accounts because the strategy was correctly sized for a trader with twice the capital and four times the patience.
Write your soft pause level, your hard kill-switch level, and the dollar figure each one represents on a sticky note before you deploy a single dollar. Then build the code that enforces it without asking your permission. Discipline beats prediction, and a kill switch beats both.
Running a bot and want it stress-tested against real drawdown math instead of a glossy backtest? Submit it for review.
Stay alpha.
The FullStack Alpha research desk tests AI trading bots on paper and live accounts. Reviewed and edited by Jay Rocco, Founder and Editor.
