

The FullStack Alpha research desk tests AI trading bots on paper and live accounts. Reviewed and edited by Jay Rocco, Founder and Editor.
By FullStack Alpha Editorial Team | Reviewed by Jay Rocco, Chief Editor
You can get usable free historical stock data from Stooq bulk files, Alpha Vantage, Massive (formerly Polygon.io), Alpaca, Tiingo or Nasdaq Data Link, and Yahoo Finance by way of unofficial wrappers. Before you trust a single backtest result, check three things: whether prices are adjusted for splits and dividends, whether delisted companies are included, and whether bars are missing on real trading days. Free data is good enough to learn a process and test daily swing setups. It stops being good enough when you need intraday tick accuracy, full options chains, or a clean list of what a stock index held in 2014 rather than what it holds today.
What You Should Know
- Yahoo Finance moved CSV historical downloads behind its Gold plan. Yahoo’s own plan page advertises CSV export of prices, dividends, splits and roughly 40 years of financial statements as a paid feature.
- Twelve Data’s site lists 800 API requests per day on its free Basic plan, covering more than 190,000 stocks across 250+ exchanges in 90+ countries.
- Financial Modeling Prep’s free plan allows 250 requests per day, and its own docs describe it as personal-use access to roughly five years of U.S. stock history.
- Massive (formerly Polygon.io) publishes a free Basic stocks tier at $0 per month with five API calls per minute, end-of-day data, and two years of history as of its October 2026 documentation.
- Stooq still posts downloadable bulk history files. Its June 5, 2026 directory listed a U.S. daily package of about 509 MB, with separate files for world, U.K., Japan, Hong Kong and Poland.
Every one of those limits can change next quarter. Check the official page before you build anything on it.
What Is Historical Stock Data and Why Do You Need It?
Historical stock data is the recorded price and volume history of a security over time, usually stored as OHLCV bars (open, high, low, close, volume) at daily, hourly or minute intervals. You need it because a trading rule with no history behind it is a hunch wearing a suit.
Backtesting means running your rules against the past to see what would have happened. No history, no backtest. And without a backtest, you’re funding your education with live money, which is the most expensive tuition on earth.
Three layers of historical stock data matter:
- Price bars. OHLCV at your chosen interval. The raw material.
- Corporate actions. Splits, dividends, ticker changes, mergers, spin-offs. The adjustments that keep a price series honest.
- Universe membership. Which tickers existed and traded on a given date, including the ones that died.
Most free providers hand you the first layer cleanly, the second layer partially, and the third layer almost never. That gap is where backtests go to lie to you.
Practical takeaway: before you download anything, write down which of those three layers your strategy actually depends on. A simple moving-average crossover on SPY needs layer one. A small-cap screener needs all three.
Where Can You Get Free Historical Stock Data?
Six sources are still worth your time in 2026: Stooq, Alpha Vantage, Massive (formerly Polygon.io), Alpaca, Tiingo and Nasdaq Data Link, plus Yahoo Finance with an asterisk the size of a billboard. Each has a different sweet spot, and none of them gives you everything.
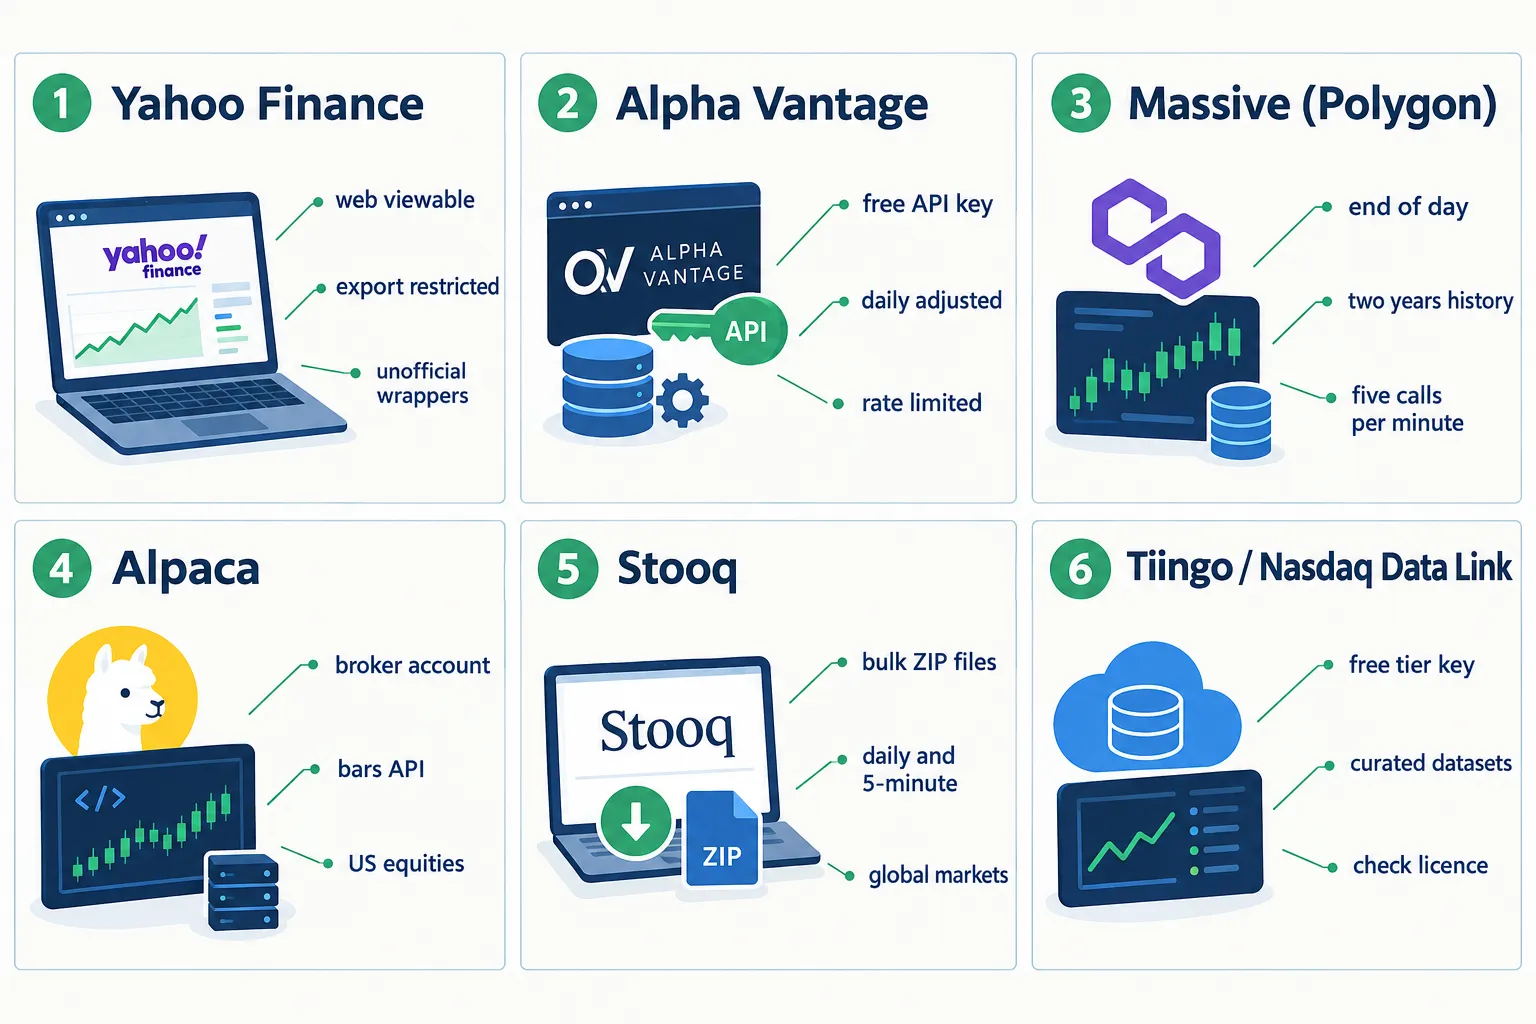
Yahoo Finance. Still the best place to eyeball a chart. No longer a dependable free bulk download. Yahoo’s premium plan pages now advertise CSV export of historical prices, dividends, splits and about 40 years of financial statements as a Gold feature. The data is still viewable on the site, and unofficial Python wrappers still pull it, but unofficial endpoints get rate-limited or restructured without warning. Verdict: fine for a quick look, risky as a pipeline.
Alpha Vantage. Free API key, daily adjusted and intraday endpoints, generous historical depth on daily series. Rate limits are tight and the free tier has shifted repeatedly over the years, so confirm the current per-minute and per-day caps on the official page before you write code against it. Verdict: the easiest free historical data API to start with.
Massive (formerly Polygon.io). Documentation current as of October 2026 lists a free Basic stocks tier at $0 per month, five API calls per minute, end-of-day data and two years of history. Two years is thin for a long-horizon study and plenty for testing plumbing. Verdict: clean, professional, deliberately limited.
Alpaca. You need a brokerage account, but the market data API gives you historical bars on U.S. equities alongside execution. If you’re building a bot that will eventually trade, pulling history from the same vendor that will fill your orders removes a whole class of mismatch bugs. Verdict: best free option if your endgame is automation. Our Alpaca review covers the feed limits in detail.
Stooq. The unglamorous workhorse. Downloadable historical market files in bulk, no API key, no sign-up form. The June 5, 2026 directory showed U.S. daily data at roughly 509 MB, with daily, hourly and five-minute packages and separate archives for world, U.K., Japan, Hong Kong and Poland. Verdict: the fastest route to a full local dataset.
Tiingo and Nasdaq Data Link. Both offer free API keys with curated end-of-day equity data. Tiingo is known for its adjusted price handling; Nasdaq Data Link hosts a mix of free and paid datasets with very different licence terms per dataset. Read the licence on the specific dataset page, not the homepage. Verdict: good free historical stock data for research, check the redistribution rules before anything commercial.
A reminder that costs people real money: technical access and licence permission are not the same thing. Several providers draw a hard line between personal research, API testing and production or redistribution use. If you plan to publish or resell anything built on free historical stock data, read the terms first.
Common mistake: grabbing data from four sources and merging them without noting which one each row came from. When a result looks weird six months later, you won’t be able to trace it.
How Do the 6 Free Sources Compare?
The short version: Stooq wins on history depth and bulk convenience, Alpaca wins if you’re building a bot, Massive wins on data hygiene inside a small window, and no one on this list reliably ships delisted tickers. Here’s the field.
| Source | History depth | Split/dividend adjusted | Delisted tickers | Free limit | Format | Date checked |
|---|---|---|---|---|---|---|
| Yahoo Finance | Decades viewable on site; ~40 yrs financials listed under Gold | Adjusted close shown on site | Not documented as included | CSV export advertised as Gold plan feature | Web, unofficial wrappers | Oct 2026 |
| Alpha Vantage | Long daily history; check official docs for exact span | Adjusted endpoints offered; confirm on docs page | Not documented as included | Check official page (free tier limits change) | JSON, CSV via API | Oct 2026 |
| Massive (ex-Polygon.io) | 2 years on free Basic | Check official docs | Not documented on free tier | $0/mo, 5 calls per minute, end-of-day | JSON via API | Oct 2026 |
| Alpaca | U.S. equity bars; check docs for exact start date | Adjustment parameter available; confirm in docs | Not documented as included | Free with brokerage account; see rate limits on docs | JSON via API | Oct 2026 |
| Stooq | Long daily history in bulk archives | Check the file documentation | Not documented as included | No key required; ~509 MB U.S. daily package | ZIP/CSV bulk download | Jun 5, 2026 |
| Tiingo / Nasdaq Data Link | End-of-day equity history; varies by dataset | Tiingo publishes adjusted prices; check dataset page | Varies by dataset; check licence | Free API key, limits on official page | JSON, CSV via API | Oct 2026 |
Three notes on reading that table honestly.
“Check the official page” is not laziness. Free tiers get rewritten quietly. Twelve Data currently advertises 800 requests per day on its free Basic plan with real-time U.S. coverage inside that quota. Financial Modeling Prep currently allows 250 requests per day, personal use, mostly U.S., around five years of history. Both numbers are from their own pages and both could move. Quoting a stale limit in your code comments is how you end up debugging an HTTP 429 at 9:28 a.m.
No one here advertises survivorship-clean universes. If a provider’s docs don’t say “includes delisted securities,” assume they don’t. That’s one of the biggest reasons free backtest results come back looking better than they should.
Format matters less than you think. CSV versus JSON is a twenty-minute problem. Survivorship bias is a twenty-month problem.
Decision rule: choose Stooq if you want everything local tonight. Choose Alpaca if the backtest is a prototype for a live bot. Choose Massive if you want clean, documented end-of-day data and two years is enough. For a broader map of what’s out there, see our roundup of stock data APIs built for AI workflows.
What Data Quality Checks Matter for Backtesting?
Six checks catch most of the damage: splits, dividends, delistings, missing bars, time zones, and the wider set of corporate actions. QuantStart’s framing holds up well here, naming accuracy and cleanliness, survivorship bias, and corporate-action adjustment as the three central equity data problems, all of which outrank your choice of file format or vendor.
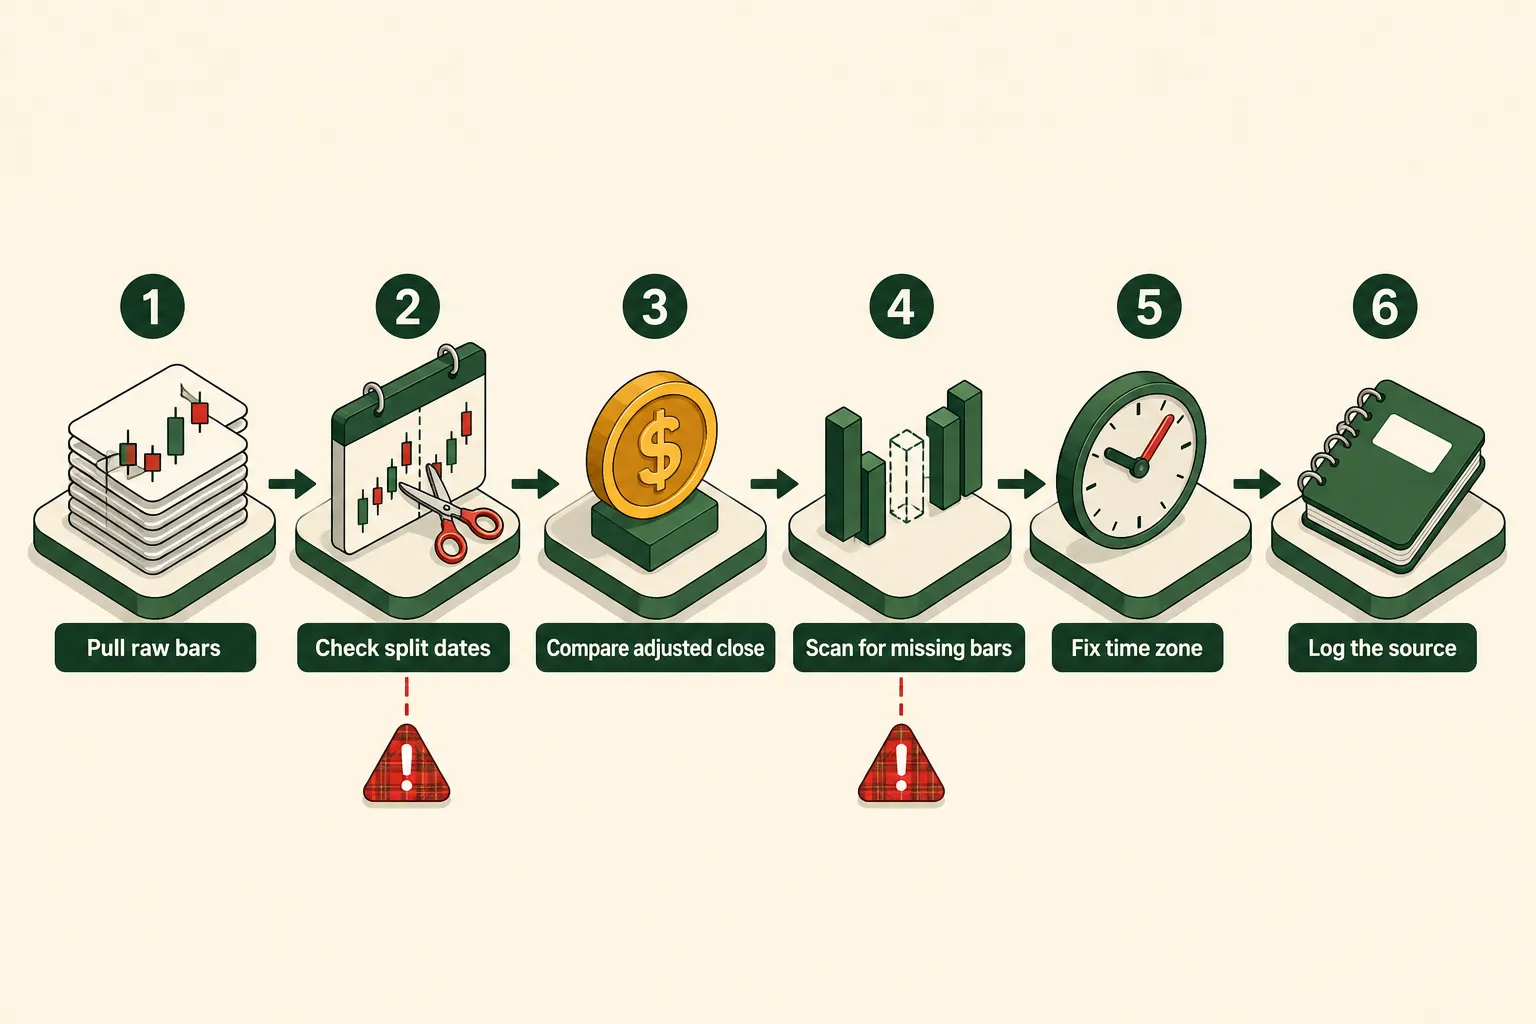
| Check | How to test it | What breaks if you skip it |
|---|---|---|
| Splits | Pull a known split, like AAPL’s 4-for-1 in August 2020. Look for a single-day drop near 75% in unadjusted data | A 4-for-1 looks like a 75% crash. Momentum and stop-loss rules fire on fiction |
| Dividends | Compare adjusted close to raw close on an ex-dividend date for a high-yield name | Total return gets understated. Dividend strategies test as losers |
| Delistings | Count tickers in your universe in 2015 versus today. If the old year has fewer names, the dead ones are missing | Backtest inflates. Losers were quietly deleted from the sample |
| Missing bars | Compare your trading-day count against the NYSE calendar for the same year | Indicators drift. A 20-day average built from 17 bars isn’t a 20-day average |
| Time zones | Check whether timestamps are exchange local, UTC or your machine’s zone | Intraday entries land one bar early or late. Overnight gaps get attributed to the wrong day |
| Corporate actions | Spot-check a ticker change, a merger and a spin-off | Price history snaps or duplicates at the event date |
An adjusted-close column is a start, not a finish. A research-grade dataset reconciles forward and reverse splits, cash and special dividends, stock dividends, ticker changes, mergers, acquisitions, spin-offs and rights offerings. Free sources handle the first two or three reasonably and go quiet on the rest.
Quick example of how ugly this gets: a reverse split in a struggling small cap, say 1-for-10, multiplies the price by ten overnight in unadjusted data. Your breakout scanner sees a 900% move and flags the strongest setup it’s ever seen. You just built a screener that finds companies in trouble and calls them winners. Play stupid games.
What’s the difference between adjusted and unadjusted prices?
Unadjusted prices are what actually printed on the tape that day. Adjusted prices rewrite history backwards so that splits and dividends don’t create fake gaps in the series.
Use adjusted prices for return calculations, indicators, and any backtest that measures performance. Use unadjusted prices when you need the actual dollar level, like testing a rule that only buys stocks trading under $20, or modelling position sizing in share counts.
Mixing them is the quiet killer. If your signal fires on adjusted prices and your fill price comes from unadjusted data, your backtest is running two different realities side by side.
Does free historical stock data include dividends and stock splits?
Usually splits, sometimes dividends, rarely both documented clearly. Most free providers ship an adjusted-close field that folds in splits and ordinary cash dividends. Special dividends, stock dividends and rights offerings are where free datasets go silent.
Test it yourself rather than trusting the marketing copy. Pick a reliable dividend payer, find a known ex-dividend date, and check whether the adjusted close on the prior day differs from the raw close by roughly the dividend amount. If the two columns are identical, your data isn’t adjusted at all, whatever the header says.
Why Does Survivorship Bias Break a Backtest?
Survivorship bias is what happens when your dataset only contains companies that are still around today. The losers were removed, so the past looks far kinder than it was. It’s the single most common reason a free-data backtest produces a beautiful equity curve that collapses in live trading.
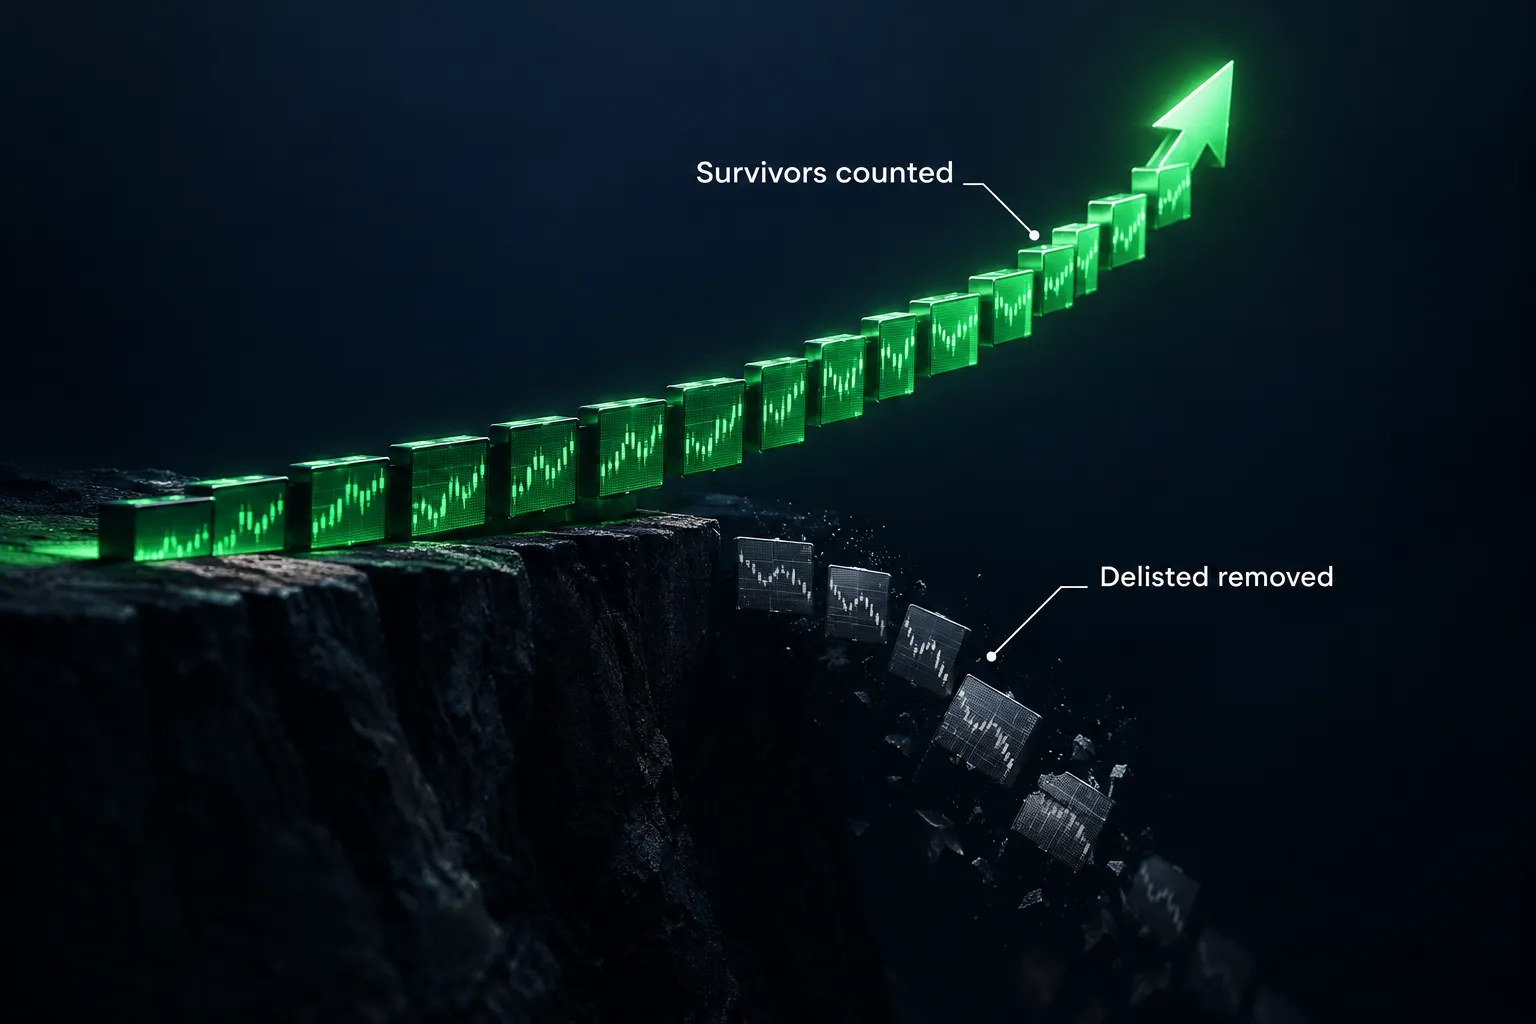
QuantStart warns directly that free and cheap datasets often omit companies that no longer trade, and that excluding bankrupt or delisted names generally makes historical strategies look more profitable than they were. Think of it as judging a marathon by interviewing people at the finish line. Everyone you talk to finished.
Over on r/algotrading, this comes up constantly in threads where a trader posts a strategy returning something implausible and the first three replies ask about survivorship bias. Treat those as user reports from people who learned it the hard way, not as verified research, and then go check your own universe anyway.
Two versions of the problem, and the second one catches people who think they’ve solved the first.
Version one: the dead are missing. Your universe for 2012 contains only tickers that still trade in 2026. Every bankruptcy, buyout and delisting has been erased.
Version two: the dead are present but wrong. Including delisted stocks isn’t enough on its own. A usable dataset also records the terminal return, the delisting reason, merger consideration, liquidation proceeds, and the effective date. Without those, a failed company sits in your file and still contributes a wrong return, which can be worse than its absence because now you think you’ve handled it.
There’s a close cousin here worth naming: using today’s index constituents as a stand-in for historical membership. Testing an S&P 500 strategy against the 500 companies in the index right now imports information from the future, because membership changed over the whole period. That’s look-ahead bias wearing a survivorship costume, and we cover the mechanics in our piece on look-ahead bias in backtesting.
Practical takeaway: run your strategy on liquid large-cap ETFs first. Index ETFs don’t go bankrupt, so survivorship bias barely touches them. If the edge survives there, then go argue with a small-cap universe.
How Do You Download Historical Stock Data as a CSV?
The fastest free route to a historical stock data CSV is Stooq’s bulk archive: download a ZIP, extract, and you have thousands of per-ticker CSV files on disk with no key and no quota. The second route is Alpha Vantage’s API with the CSV output parameter, one ticker at a time.
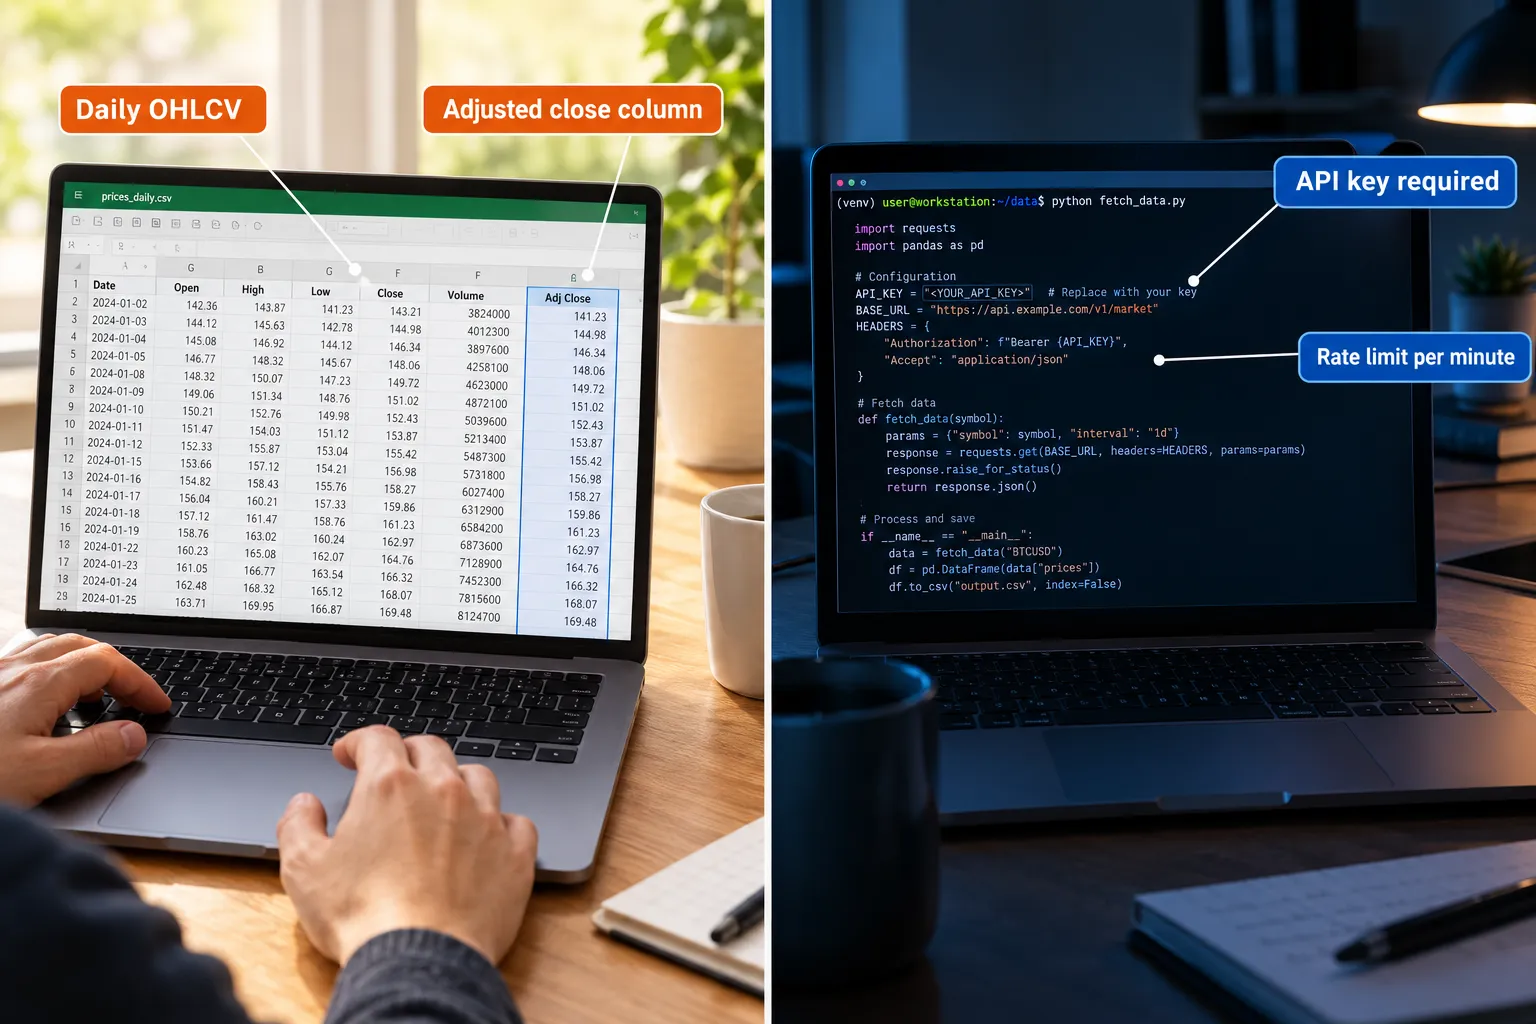
Route one: Stooq bulk download.
- Open Stooq’s historical database directory. Pick the region and interval you need. The June 5, 2026 listing showed U.S. daily at roughly 509 MB, with separate world, U.K., Japan, Hong Kong and Poland packages.
- Download the ZIP. On a normal connection this takes a few minutes.
- Extract it. You’ll get a folder tree of individual CSV files, one per ticker, each with date and OHLCV columns.
- Load one file and check the column headers and the date format before you write any parsing code. Date formats vary by region package.
- Spot-check a ticker you know had a split. Confirm whether the file is adjusted. Don’t assume.
Route two: Alpha Vantage single-ticker CSV.
- Request a free API key on the Alpha Vantage site. It arrives instantly.
- Pick the endpoint that matches your interval, such as the daily adjusted series.
- Set the output format parameter to CSV and the output size to full for the longest available history.
- Save the response to disk with the ticker and the pull date in the filename. Future you will thank present you.
- Respect the rate limits on the official page. Looping over 500 tickers without a delay gets you throttled fast.
One habit that separates working datasets from junk drawers: store the source name and the download date in a sidecar file next to every dataset. When two backtests disagree, the first question is always “which data was this?” and you want an answer, not a guess.
How far back can you get free historical stock data?
It ranges from two years to several decades, depending entirely on the provider. Massive’s free Basic tier documents two years of history as of October 2026. Financial Modeling Prep’s free plan documents roughly five years. Stooq’s bulk archives and Alpha Vantage’s full daily series go back considerably further, though exact start dates vary by ticker and exchange.
Depth needed by strategy type:
- Intraday scalping: 6 to 24 months of minute bars, assuming the regime you’re trading still exists
- Swing trading, days to weeks: 5 to 10 years, enough to cover at least one real drawdown
- Long-horizon or factor work: 20 years minimum, and you need delisted names, which pushes you toward paid
Decision rule: if your strategy has never been tested through a market that fell 20% or more, your sample is too short. That’s a history-depth requirement, not an opinion.
Is There a Free Historical Data API for Bots?
Yes. Alpha Vantage, Massive, Alpaca, Tiingo and Twelve Data all publish free API tiers that return historical bars programmatically. The constraint isn’t access, it’s throughput. Free rate limits are built for testing, not for sweeping a thousand tickers every morning.
Confirmed limits from provider pages:
- Massive (ex-Polygon.io): free Basic stocks tier at $0 per month, five API calls per minute, end-of-day data, two years of history, per October 2026 docs
- Twelve Data: 800 requests per day on the free Basic plan, 190,000+ stocks, 250+ exchanges, 90+ countries, with real-time U.S. data inside the quota
- Financial Modeling Prep: 250 requests per day, personal use, mostly U.S., about five years of history
- Alpha Vantage, Alpaca, Tiingo: check the official pages, these change often enough that printing a number here would age badly
Do the arithmetic before you design anything. Five calls per minute is 300 per hour. A 500-ticker universe needs roughly 100 minutes for one full refresh. That’s fine for a nightly job and useless for anything that needs to react during power hour.
Architecture that actually works on free tiers:
- Pull history once in bulk, from Stooq or a one-time API sweep, and store it locally
- Use the API only for the daily delta, the new bar, not the whole series
- Cache everything, assume every call might fail, and build retry logic on day one
- Keep a local database as the source of truth so a vendor policy change doesn’t brick your bot
If you’re assembling the broader stack, we’ve covered AI trading bots with free tiers and the wider field of free AI stock screeners that can sit on top of a dataset like this.
Common mistake: writing code that works perfectly against 10 tickers in testing, then pointing it at 800 and getting rate-limited into silence. Test your throughput at full scale before you trust the pipeline.
Do you need real-time data or is historical data enough?
For backtesting, historical data is enough. Real-time data only matters at the moment of execution, which is a separate problem from deciding whether your rules work.
Where that line moves:
- Building and validating a strategy: historical only, no exceptions
- Paper trading a daily or swing system: delayed quotes are usually fine
- Running a live intraday bot: real-time feeds become necessary, and the free tiers mostly stop being an option
Latency is worth measuring in yourself, too. A scan that surfaces a mover four minutes late is a history lesson, not a trade, and so is a human who takes four seconds to react. Our trader reaction time test makes the point faster than an article can.
Is free historical data good enough for day trading?
For learning the mechanics, yes. For validating a live intraday strategy, usually no.
Day trading backtests need minute or second bars, and free intraday history is typically shallow, sometimes gap-filled, and rarely includes the bid-ask spread. Without spread data, your backtest assumes you got filled at the mid price every single time. You didn’t. On a low-float name with a wide spread, that assumption alone can flip a profitable system into a losing one.
Stooq publishes five-minute packages, which helps for coarse intraday work. Below that interval, free data thins out fast and the gap between backtest and live fills widens with it.
Where Do You Get Historical Options Data?
Free historical options data barely exists in any usable form. Equity prices are commoditised; options chains are not. Dedicated vendors like Theta Data exist precisely because the data is expensive to store and expensive to clean.
Why options data costs more:
- Dimensionality. One stock has one daily price. One stock’s option chain has hundreds of strikes across dozens of expirations, every day. The storage requirement explodes.
- Expiration churn. Contracts are born and die constantly. A historical chain has to record contracts that no longer exist, which is survivorship bias on hard mode.
- Greeks and implied volatility. Either the vendor computes them, which means publishing their model assumptions, or you compute them yourself and need a clean risk-free rate and dividend assumptions to do it.
- Spreads. Options spreads are wide. A backtest using only last-trade prices will overstate results badly. You need bid and ask at the timestamp.
What you’ll find free: some brokers expose a limited options history through their API for account holders, and some sites post end-of-day chain snapshots with shallow depth. What you won’t find free: multi-year, tick-level, NBBO-quoted chains with greeks attached.
Decision rule: if your strategy depends on entry and exit at specific strikes, you need quoted bid-ask data, which means paying. If you’re testing a directional thesis that happens to be expressed with options, backtest the underlying first and only buy chain data once the directional edge holds up.
Our comparison of Theta Data versus GEXBot covers the dedicated options-data end of the market, and options backtesting mechanics covers what changes when contracts replace shares.
When Should You Pay for Historical Stock Data?
Pay when the specific flaw in free data would change your conclusion. Not before. A rule by strategy type:
| Strategy | Free data verdict | Why |
|---|---|---|
| Learning backtest mechanics | Free is fine | You’re debugging code and logic, not sizing capital |
| Index ETF trend following | Free is fine | ETFs don’t delist, adjustments are simple |
| Large-cap swing trading | Free mostly works | Survivorship risk is low, daily bars are well covered |
| Small-cap or micro-cap screening | Pay | Delistings and reverse splits dominate the universe |
| Factor or long-short research | Pay | Needs historical index membership and terminal returns |
| Intraday or high-frequency | Pay | Needs tick data with spreads |
| Options strategies | Pay | Quoted chains with greeks aren’t available free |
The honest threshold: when the money you’d risk on a wrong conclusion exceeds the annual cost of clean data, buy the data. If you’re testing a system that will run $5,000, a $400 annual data bill is a large tax. If it’ll run $100,000, refusing to spend $400 to avoid a survivorship-inflated result is bad arithmetic.
One in-between move most people skip: run the same backtest on two independent free sources. If Stooq and Alpha Vantage produce materially different results for identical rules, one of them has a data problem and you’ve found it for free. If they agree, your confidence goes up without spending a cent.
Can you backtest a strategy without paying for premium data?
Yes, and most retail traders should start there. A daily-bar strategy on liquid large caps or index ETFs can be validated on free historical stock data with no meaningful distortion, as long as you verify split and dividend adjustment first.
The point where free stops working is specific, not vague: survivorship-sensitive universes, intraday execution assumptions, and anything involving options chains. Everything else is testable for free.
What historical data do you need to start backtesting?
The minimum workable set is daily OHLCV bars, split and dividend adjusted, covering at least five years including one real drawdown, for a universe of 20 to 100 tickers you actually understand.
What you can skip at the start: minute bars, fundamentals, options chains, sentiment feeds, and alternative data. Those are refinements for a strategy that already works. Collecting them before you have a working rule is analysis paralysis with a storage bill attached.
Start tonight with this: daily adjusted bars for SPY, QQQ and IWM going back ten years. That’s three CSV files and about four minutes of work. If your idea can’t demonstrate anything on those, more data won’t save it.
What Should You Do If Historical Data Is Missing or Looks Wrong?
Diagnose before you patch. A gap in a price series is usually one of four things: a market holiday, a trading halt, a vendor outage, or a ticker change you didn’t account for. Each needs a different fix, and filling them all the same way corrupts your dataset.
A working triage order:
- Check the exchange calendar. Compare your missing date against the NYSE schedule. Holidays and half days account for most “gaps” people panic about.
- Check for a ticker change. Facebook became META, Google became GOOGL. A series that ends abruptly often continues under a new symbol.
- Cross-reference a second source. If Stooq has the bar and Alpha Vantage doesn’t, it’s a vendor gap, not a market event.
- Check for a halt. Low-float names get halted for volatility. A genuinely missing bar is real information, and deleting it hides something you’d want to know.
- Decide how to handle it, then document that decision. Forward-fill, drop the row, or flag and exclude the ticker. Any of these can be defensible. Silently doing something different each time is not.
Price values that look wrong get the same treatment. A single day printing 10x the surrounding range is almost always an unhandled split or a bad tick, not a real move. Flag any day where the move exceeds, say, 50% and inspect each one by hand. There usually aren’t many.
The habit that matters most: never clean data inside your backtest loop. Clean it once, save the cleaned version, and run the backtest against that. Otherwise you can’t reproduce your own results, and an unreproducible backtest is just a story with numbers in it.
Common Mistakes People Make With Free Stock Data
The failure pattern is consistent. People spend three weeks tuning strategy parameters and twenty minutes checking the data those parameters were fitted to. Backwards.
The repeat offenders:
- Assuming adjusted means adjusted. Headers lie. Verify against a known split date.
- Using today’s index members for a historical test. Future information, dressed as a universe.
- Ignoring delistings entirely. The returns improve, which is exactly why it feels right.
- Mixing sources without labelling them. Untraceable results six months later.
- Backtesting with no transaction costs. Free data has no spread column, so the default assumption is a free fill at mid. That’s a fantasy, especially on thin names.
- Testing one period and calling it validated. A strategy that worked in 2021 and only 2021 found a regime, not an edge.
- Rebuilding the same backtest after every losing week. That’s revenge trading with a spreadsheet.
Practical takeaway: before you tune a single parameter, run the six quality checks in the table above against your dataset and write down what you found. Twenty minutes there saves twenty hours of chasing a result that was never real. Systems over hacks.
Frequently Asked Questions
Is historical stock data free?
Yes, daily historical stock data is widely available free from Stooq, Alpha Vantage, Massive, Alpaca, Tiingo and Nasdaq Data Link. Free tiers come with rate limits, shallower history and usually no delisted companies. Intraday tick data, full options chains and survivorship-clean universes are where free coverage stops and paid vendors start.
Where can I download historical stock data as a CSV?
Stooq’s bulk download directory is the fastest route, producing thousands of per-ticker CSV files with no API key. Its June 5, 2026 listing showed a U.S. daily package around 509 MB, plus world, U.K., Japan, Hong Kong and Poland archives. Alpha Vantage also returns CSV directly from its API, one ticker per call.
What is the best source of historical stock data?
It depends on the job. Stooq is best for grabbing a full local dataset fast. Alpaca is best if the backtest will become a live bot, since history and execution come from the same vendor. Massive is best for clean documented end-of-day data when two years of history is enough.
Does Yahoo Finance still offer historical data downloads?
Yahoo now advertises CSV export of historical prices, dividends, splits and roughly 40 years of financial statements as a Gold plan feature. Data remains viewable on the site and unofficial wrappers still pull it, but those endpoints change or get rate-limited without notice, so it’s no longer a dependable free pipeline.
Can I get live and historical data from the same API?
Yes, with caveats. Twelve Data’s free Basic plan advertises 800 requests per day including real-time U.S. data within the quota. Alpaca provides both historical bars and live feeds to account holders. Massive’s free Basic tier is end-of-day only, so you’d need a paid plan for live.
Does free historical data include delisted companies?
Rarely, and almost never documented. If a provider’s docs don’t explicitly state that delisted securities are included, assume they’re not. Even when dead tickers appear, a usable dataset also needs the terminal return, delisting reason and effective date, or the failed company still contributes a wrong number.
How much historical data do I need for a credible backtest?
At minimum five to ten years of daily bars covering at least one market decline of 20% or more. A strategy never tested through a real drawdown has no evidence about how it behaves when things break, which is the only time the answer matters.
Our Take
Free historical stock data is good enough to learn on, good enough to prototype on, and good enough to test a daily swing system against liquid names. It is not good enough to bet serious capital on a small-cap screener, because the companies that went to zero aren’t in the file.
So check two things before you trust any result: open a known split date and confirm your prices are adjusted, then count how many tickers existed in your universe ten years ago versus today. If the older year has fewer names, your backtest is grading a test with the failures removed. Discipline beats prediction, and in data work, discipline means verifying before you optimise.
Pick one source tonight. Pull ten years of daily adjusted bars for three index ETFs. Run your six quality checks and write down what you find. That’s a real afternoon of work and it’ll do more for your results than another indicator ever will.
Built a bot on this data and want it looked at? Submit it here and we’ll put it through the same checks.
Stay alpha.
The FullStack Alpha research desk tests AI trading bots on paper and live accounts. Reviewed and edited by Jay Rocco, Founder and Editor.
