

The FullStack Alpha research desk tests AI trading bots on paper and live accounts. Reviewed and edited by Jay Rocco, Founder and Editor.
November 11, 2026, 7:55 a.m. ET | By FullStack Alpha Editorial Team | Reviewed by Jay Rocco, Chief Editor
Quick answer
The Nasdaq-100 fell 6.4% on Thursday, November 5, 2026, its worst day since March 2020. The spark was a reassessment of AI data-center spending after the midterms. The size came from machines: UBS estimated a record $307 billion of excess systematic sell flow, and Barclays modelled roughly $135 billion of volatility-control futures selling over 24 to 48 hours.
If your trading bot got shredded that day, it was standing in front of sellers with bigger balance sheets and zero discretion. Your bot has a strategy. Theirs has a mandate.
Key facts
- The Nasdaq-100 dropped 6.4% on November 5, erasing about $2.3 trillion in value per Bloomberg. The S&P 500 fell about 4.4% and the Philadelphia Semiconductor Index about 12%.
- The VIX went from roughly 16.6 to about 28 in one session. Put volume hit a record 11.23 million contracts.
- UBS estimated $307 billion of excess sell flow, the largest in its framework. Barclays modelled a cut of about 30 percentage points in vol-control equity exposure, near $135 billion of futures.
- The UBS and Barclays numbers overlap. They describe modelled exposure changes, not confirmed cash sales, so they should not be added together.
What happened on November 5, 2026?
Investors started pricing in the chance that strong Democratic midterm results could slow data-center construction and squeeze AI infrastructure spending. UBS put roughly 30% of expected 2028 data-center additions at risk of delay.
That is a real debate. A 6.4% single-day index drop is not a debate. It is plumbing. The catalyst explains the direction. The mechanics explain the size.
How did volatility-control funds make the drop bigger?
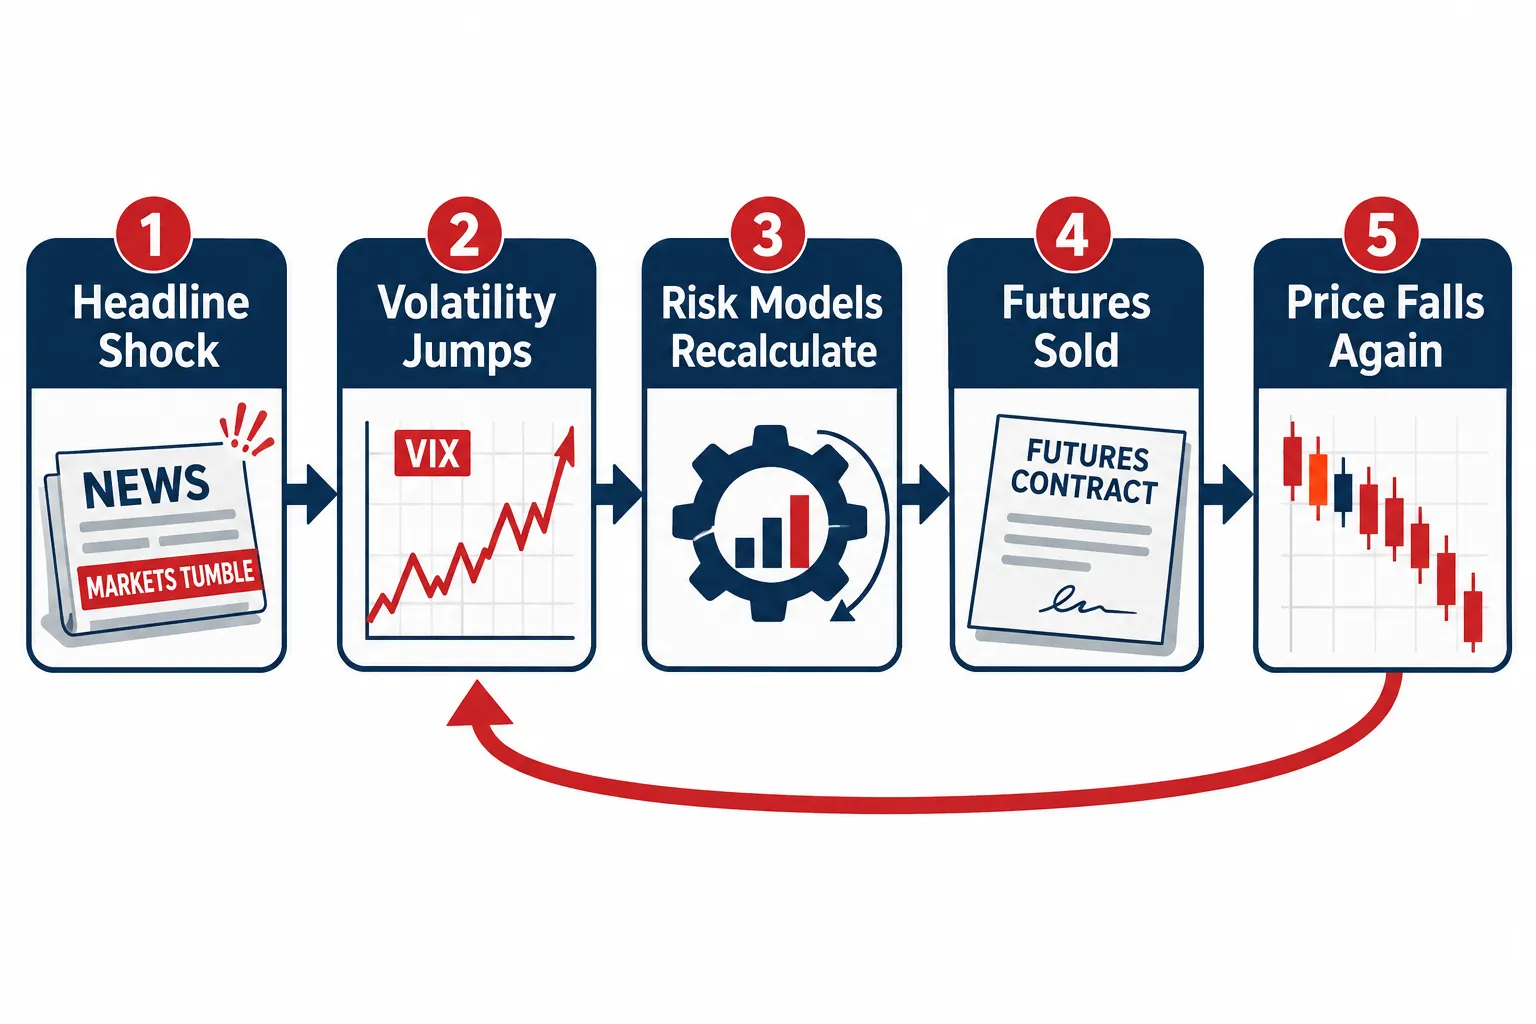
Volatility-control funds, also called vol-target or risk-control strategies, size equity exposure against realized and implied volatility. Calm tape, more stock. Violent tape, less stock. No opinion involved.
When the VIX nearly doubled, those models did not debate AI capex. They recalculated and sold. UBS estimated a further $245 billion to $330 billion of potential risk-control selling after the roughly 4% decline, with only part of it expected to execute the same day.
Nomura’s Charlie McElligott split the flow into separate channels, shown below. Leveraged ETFs added their own wave. A 3x long Nasdaq product has to sell exposure into a down day to hold its leverage ratio, near the bell. That is why the last 30 minutes of a violent day so often gets worse before it gets better.
| Estimate source | Figure | What it measures | Why it is not additive |
|---|---|---|---|
| UBS | $307B | Broad excess systematic sell flow, record in its framework | Includes risk-control activity Barclays also counts |
| Barclays | ~$135B | Vol-control futures selling over 24 to 48 hours | Subset of the broader systematic bucket |
| Nomura (vol-control) | ~$61B | Vol-control selling at that point in the move | Snapshot, not a full-session total |
| Nomura (carryover) | ~$25B | Prior selling still executing | Lagged flow, already triggered |
| Nomura (levered ETFs) | ~$47B | Close rebalance of leveraged products | Separate channel, packed into the close |
Did retail sell too?
Yes, and that is the uncomfortable half. Vanda Research described retail stock selling as the second-largest daily wave in its data outside two March 2020 sessions. JPMorgan put retail selling more than three standard deviations from normal.
Then it flipped. Retail selling reversed toward buying by midday, and once the forced flows cleared, the bounce came fast. The Nasdaq Composite rose 1.09% on November 6.
The machines sold because a model told them to. Humans sold because a chart scared them. Only one group had a plan for what came next.
What does this mean for retail trading bots?
Three failure modes showed up, and most backtests never saw any of them.
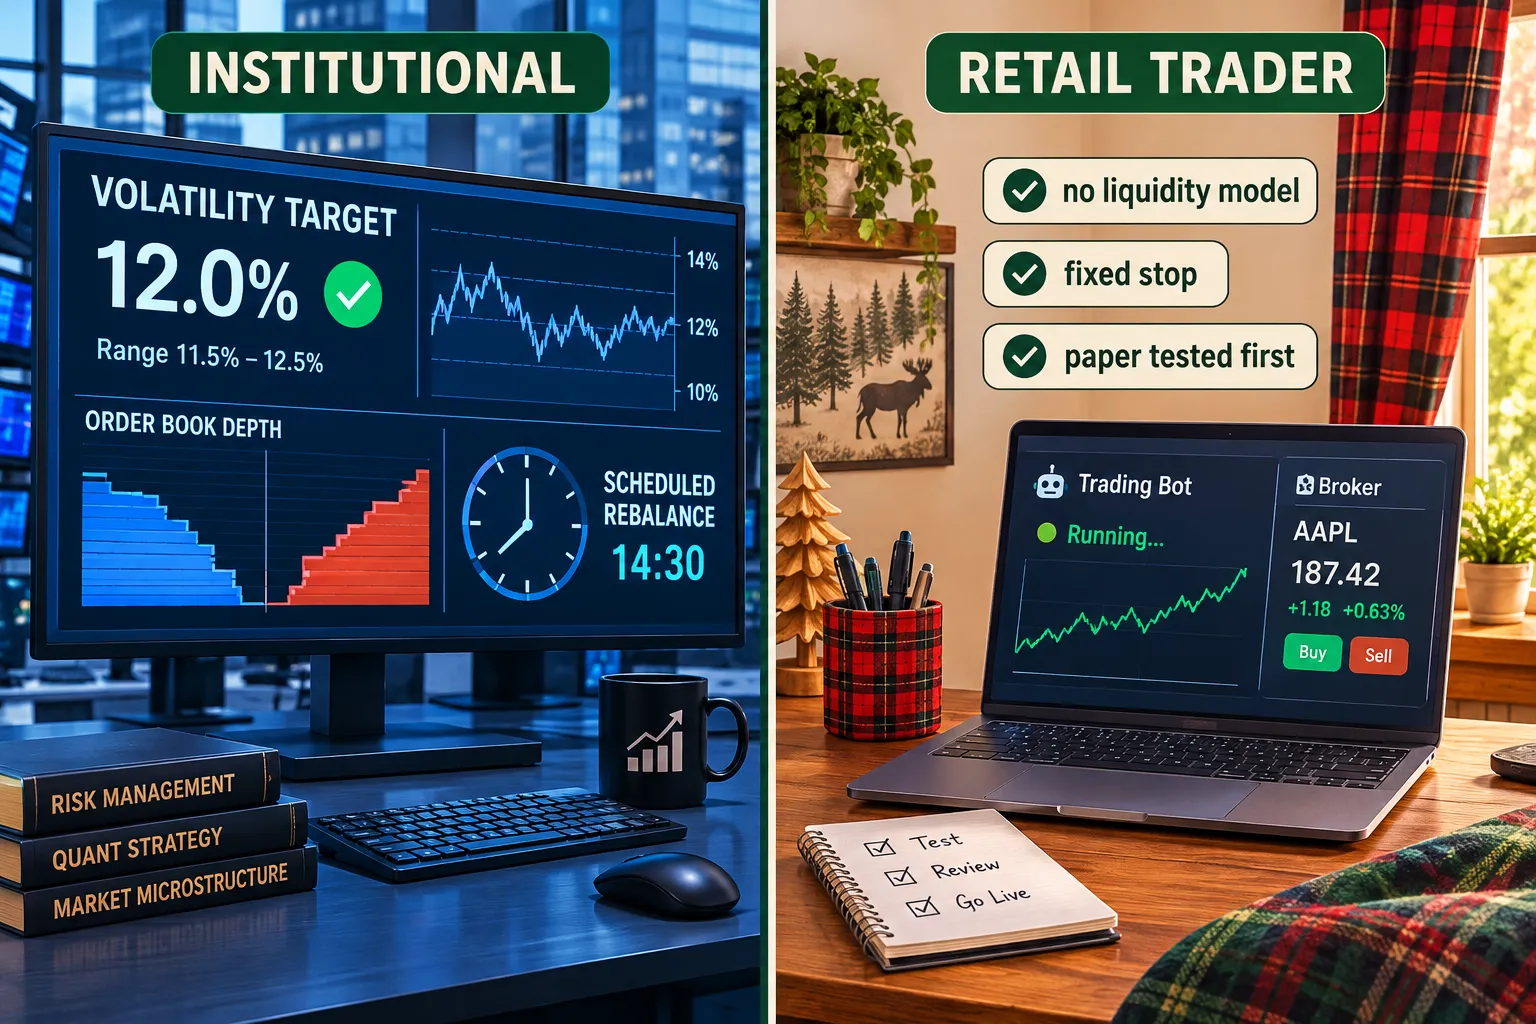
1. Liquidity assumptions broke. Your backtest filled at the midpoint. With record put volume and a VIX near 28, spreads widened and slippage ate the edge. A strategy with a 0.4% average win does not survive 0.6% of slippage.
2. Mean-reversion bots bought too early. A 6.4% drop looks like a gift to a model trained on 2023 and 2024 data. It was a falling knife with billions of modelled futures selling still scheduled for the next 24 to 48 hours.
3. Stop clusters became fuel. Retail stops sit at round numbers and obvious support. When mechanical selling drives price through those levels, the stops add volume in the same direction. Your risk control became someone else’s liquidity.
The gap is not intelligence. It is infrastructure. Institutional desks know roughly when their own rebalance hits. Your bot finds out from the price feed, after the fact. More on these mismatches in why live bot results miss the backtest.
How can a retail bot survive a mechanical selloff?
Not by predicting the next one. By being sized and throttled so it does not matter much.
- Add a volatility gate. If the VIX jumps more than about 25% intraday, or realized volatility doubles against its 20-day average, cut size or stand down. Trading the same notional at a 28 VIX as at a 16 VIX is the actual bug.
- Model slippage with real numbers. Perfect fills are fiction. Audit fill assumptions with our guide to look-ahead bias.
- Skip the last 30 minutes on high-volatility days. Roughly $47 billion of levered-ETF rebalancing landed near the close on November 5, per Nomura.
- Cap daily loss at the system level. Eight correlated positions can gap the same way. One kill switch beats eight stops. See how much drawdown is too much.
- Paper trade the new rules first. Start with what paper trading actually tests, and judge execution with our broker API guide.
| Risk control | Institutional version | Realistic retail bot version |
|---|---|---|
| Volatility sizing | Continuous vol-target model, daily rebalance | Halve size when the VIX jumps 25% intraday |
| Execution | Spread over hours, multiple venues | Limit orders only above a VIX threshold |
| Correlation control | Full factor risk model | Cap total exposure to one theme, such as AI semis |
| Kill switch | Risk committee and mandate limits | Daily max drawdown halts trading until manual restart |
| Liquidity check | Order book depth monitoring | Minimum volume and max spread filter per symbol |
What should investors watch next?
- Remaining CTA triggers. UBS research cited by C Scott Garliss put the next S&P 500 close-based CTA sell trigger near 7,348, about 0.4% below the November 6 close. The Nasdaq had no close-based triggers left.
- Buyback window. UBS sees buybacks rising to $35 billion to $55 billion per week from the week of November 16, a mechanical bid that runs the other way.
- The VIX. A second spike would restart vol-control selling, since those funds rebalance one to two sessions after a jump.
Our take
November 5 was not a market judging AI. It was a market rebalancing itself, fast, with forced sellers that never read a headline.
Retail bots do not lose to these flows because the signals are bad. They lose because the risk layer is thin and the fill assumptions are optimistic. The fix is boring and it works: volatility-aware sizing, real slippage, a hard daily loss cap, and no market orders when the tape is tearing.
Your next step: open your bot’s config today and write down three answers. What it assumes about slippage, what size it takes when volatility doubles, and what stops it when the day goes wrong. Any blank is the first thing to fix, on paper, before real money sees another session like this one.
Did your bot survive November 5? Show us the logs, not the hot take.
FullStack Alpha has tested 200+ AI stock tools since 2022, and every submission gets checked before it gets covered.
This article is for education only and is not financial advice. Trading with bots and leverage can lose money fast. Check any tool’s claims at Investor.gov before you fund an account.
Sources
- C Scott Garliss, “The Mechanical Selling Has Almost Run Its Course” (UBS estimates), Nov 9, 2026
- The Private Banker, “Systematic Funds Amplified the $2.3 Trillion Nasdaq 100 Rout” (Barclays, Goldman Sachs data), Nov 6, 2026
- Yahoo Finance, Nov 5, 2026 live coverage (Vanda Research, Nomura)
- NBC News, “Stocks plunge as election outcome and AI worries crush tech shares”
- Kitco, “Volatility control funds near record equity exposure,” Oct 1, 2026
Your market edge starts with the right tool. Stay alpha.
Frequently Asked Questions
Did systematic funds cause the November 5 selloff?
No. They amplified it. The catalyst was a reassessment of AI data-center spending after the midterms, and mechanical selling turned that repricing into a 6.4% Nasdaq 100 day.
Can you add the UBS $307 billion and Barclays $135 billion figures?
No. UBS measured broad excess systematic sell flow and Barclays modelled a specific vol-control exposure cut. They overlap, and both describe modelled exposure shifts, not confirmed cash sales.
What is a volatility-control fund in plain English?
A fund that targets a fixed level of portfolio volatility. When markets get choppy it automatically holds less stock, and when markets calm it holds more. No human is choosing, which is why the selling clusters.
Why did the market bounce so fast on November 6?
Once the forced flows largely cleared, the sellers were gone. Retail selling had already flipped toward buying, and the Nasdaq Composite rose 1.09% on November 6.
Should a retail trading bot shut down during high volatility?
Cutting size is usually smarter than a full shutdown, with a hard halt when the daily loss limit trips. Either way, write the rule in advance instead of improvising it mid-session.
Is this article financial advice?
No. This article is for education only. Do your own research and check any trading tool's claims before you fund an account.
The FullStack Alpha research desk tests AI trading bots on paper and live accounts. Reviewed and edited by Jay Rocco, Founder and Editor.
