

The FullStack Alpha research desk tests AI trading bots on paper and live accounts. Reviewed and edited by Jay Rocco, Founder and Editor.
By FullStack Alpha Editorial Team | Reviewed by Jay Rocco, Chief Editor
Learning how to read candlestick charts starts with one object: a single candle that shows four prices for one slice of time. The body spans the open and close, the wicks (thin lines above and below) mark the high and low, and the color tells you whether buyers or sellers won that slice. A green or hollow body means the close was above the open. A red or filled body means the close was below. Before any bot trade, run a six-point checklist: trend, level, volume, news, position size, stop.
What You Should Know
- A candlestick encodes exactly four data points per bar: open, high, low, close. Nothing else is in there.
- A 2026 paper published in the African Journal of Scientific Research reported pattern-by-pattern accuracy that varies wildly: hammer at 59.86%, bullish engulfing at 54.35%, bearish engulfing at 42.39%, hanging man at 41.56%.
- A University of Luxembourg study found candlestick pattern success rates between 48% and 58%, averaging 51% for bullish patterns and 49% for bearish, and concluded short-hold signals weren’t profitable after proper testing.
- FINRA Regulatory Notice 15-09 lays out five areas for anyone running automated strategies: risk assessment, code development, software testing and validation, trading systems, and compliance.
- The CFTC’s Innovation Task Force scheduled a Frontier Forum on AI and “agentic finance” for October 28, 2026, covering AI systems that execute trades under existing derivatives rules.
How Do You Read a Candlestick Chart?
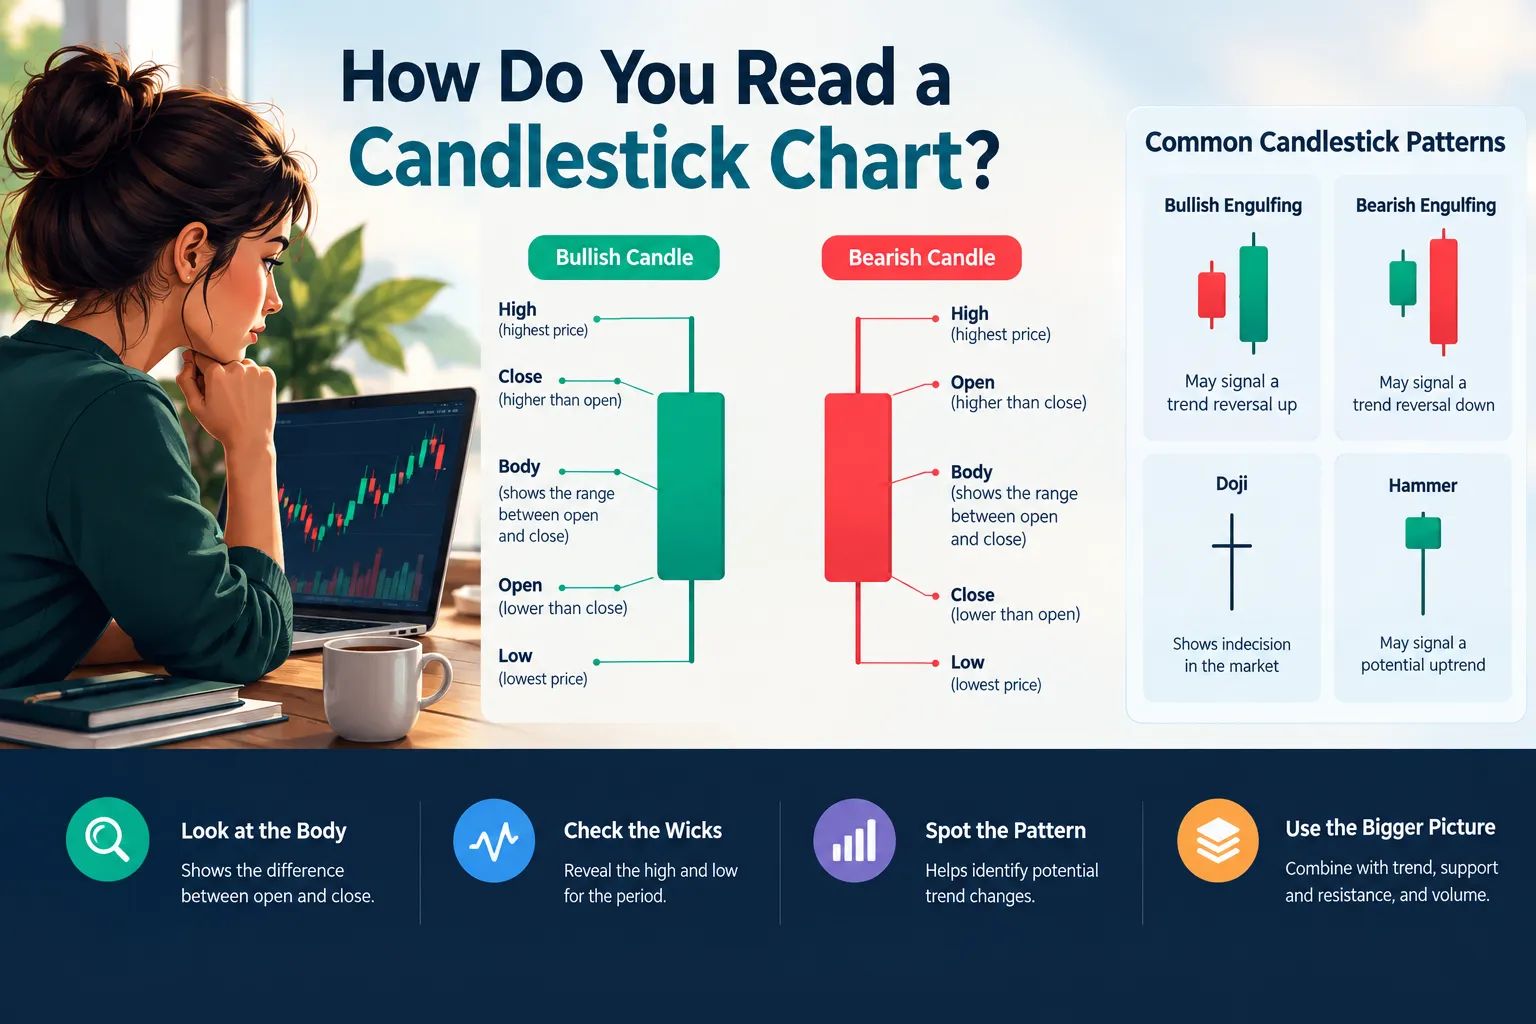
Read it in this order: body first, wicks second, color third, context fourth. One candle tells you where price opened, how far it stretched in each direction, and where it settled. That’s it. Everything else you think you see is interpretation.
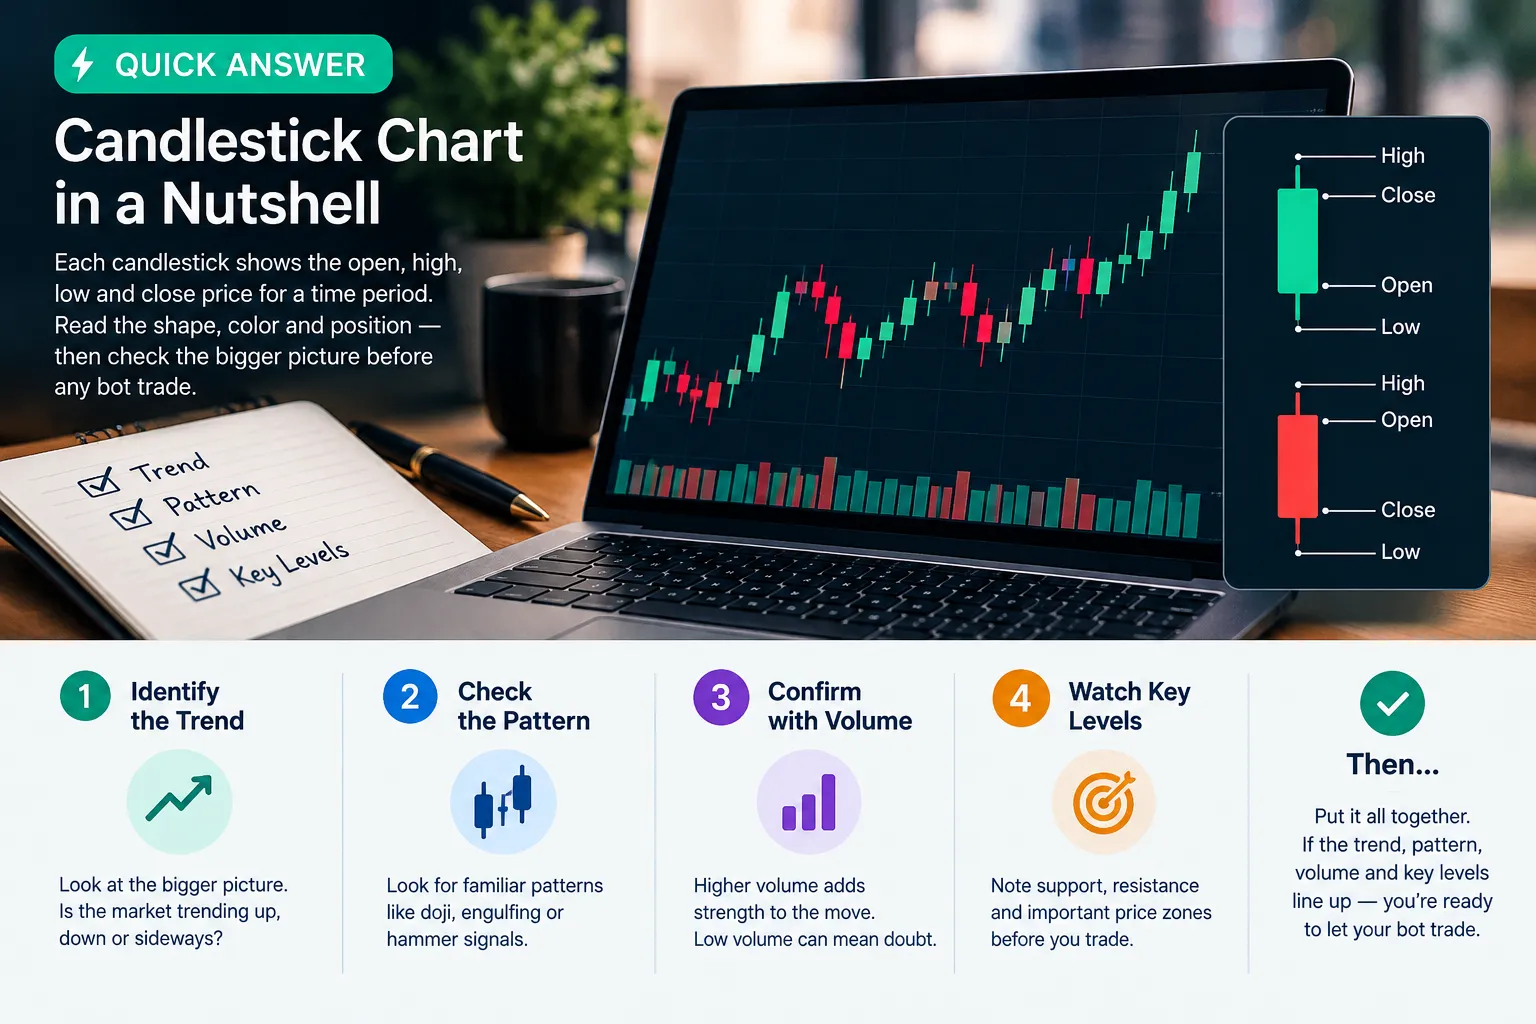
What’s the difference between open, high, low, and close on a candle?
Four prices, one time slice.
- Open, the first traded price when the candle’s period began.
- High, the highest price touched during that period.
- Low, the lowest price touched.
- Close, the last traded price when the period ended.
On a 5-minute chart, each candle covers five minutes. On a daily chart, each candle covers one full session. The open of a daily candle is the 9:30 a.m. ET price, and the close is the 4:00 p.m. ET price. Same four numbers, different window.
The body is the distance between open and close. The wicks are everything price tried and failed to keep.
What do the wicks on a candlestick actually mean?
A wick (also called a shadow or tail) marks rejection. Price went there, and then it came back.
A long lower wick means sellers pushed price down during the period, and buyers shoved it back up before the close. A long upper wick means the opposite: buyers tried, sellers won the argument. The length of the wick relative to the body is the information. A tiny wick on a fat body means one side controlled the whole period. A huge wick on a tiny body means a fight with no winner.
Quick example: a stock opens at $50, drops to $47, rallies, and closes at $50.80. You get a small green body between $50 and $50.80 and a long lower wick reaching $47. Buyers absorbed a three-dollar flush. That’s worth noticing. It is not, by itself, a reason to buy.
How do you tell if a candlestick is bullish or bearish?
Compare close to open. Close above open is bullish for that period. Close below open is bearish for that period. Color is just a visual shortcut for that comparison, and it’s customizable on every platform, so never trust color alone when you’re reading someone else’s screenshot.
Default color schemes:
| Candle | Meaning | Common colors |
|---|---|---|
| Bullish | Close above open | Green, white, hollow |
| Bearish | Close below open | Red, black, filled |
| Doji | Close roughly equals open | Gray or either, body is a thin line |
One warning that trips up beginners learning how to read stock charts: a green candle can still be a disaster. A stock that gaps down 8% at the open and closes 1% above that open prints a green candle on a brutal day. The candle measures the period, not the move.
How can I read candlesticks as a beginner?
Strip the chart naked. Remove every indicator. One instrument, one timeframe, bars only.
- Pull up a daily chart of a liquid name you already follow.
- Mark the highs and lows that price has reacted to more than once. That’s support and resistance, the price areas where buyers or sellers showed up before.
- Look at the last 20 candles. Is the sequence making higher highs and higher lows, lower highs and lower lows, or neither?
- Find the three biggest bodies on the screen and check what happened the next day.
- Find the three longest wicks and do the same.
Thirty minutes of that beats three hours of YouTube. If you want the broader foundation, our AI trading for beginners section walks through the basics without the guru energy.
What’s the difference between candlestick charts and line charts?
A line chart plots one price per period, usually the close, and connects the dots. A candlestick chart plots four. You lose the entire intraday battle on a line chart.
| Chart type | Data shown | Best for |
|---|---|---|
| Line | Close only | Long-term trend shape, clean presentation |
| Bar (OHLC) | Open, high, low, close | Same data, thinner visual |
| Candlestick | Open, high, low, close | Reading short-term buying and selling pressure |
Why do traders prefer candlesticks over other chart types?
Pattern recognition speed. The filled body makes direction readable at a glance, and the wick-to-body ratio makes conviction readable without doing math. A bar chart holds identical data, but your eye has to work harder. On a 20-monitor desk during power hour, that difference matters.
Candlestick charting traces back to Japanese rice traders and reached Western markets largely through Steve Nison’s work in the 1990s. The format stuck because it’s efficient, not because it’s magic.
What Are the Main Candlestick Patterns?
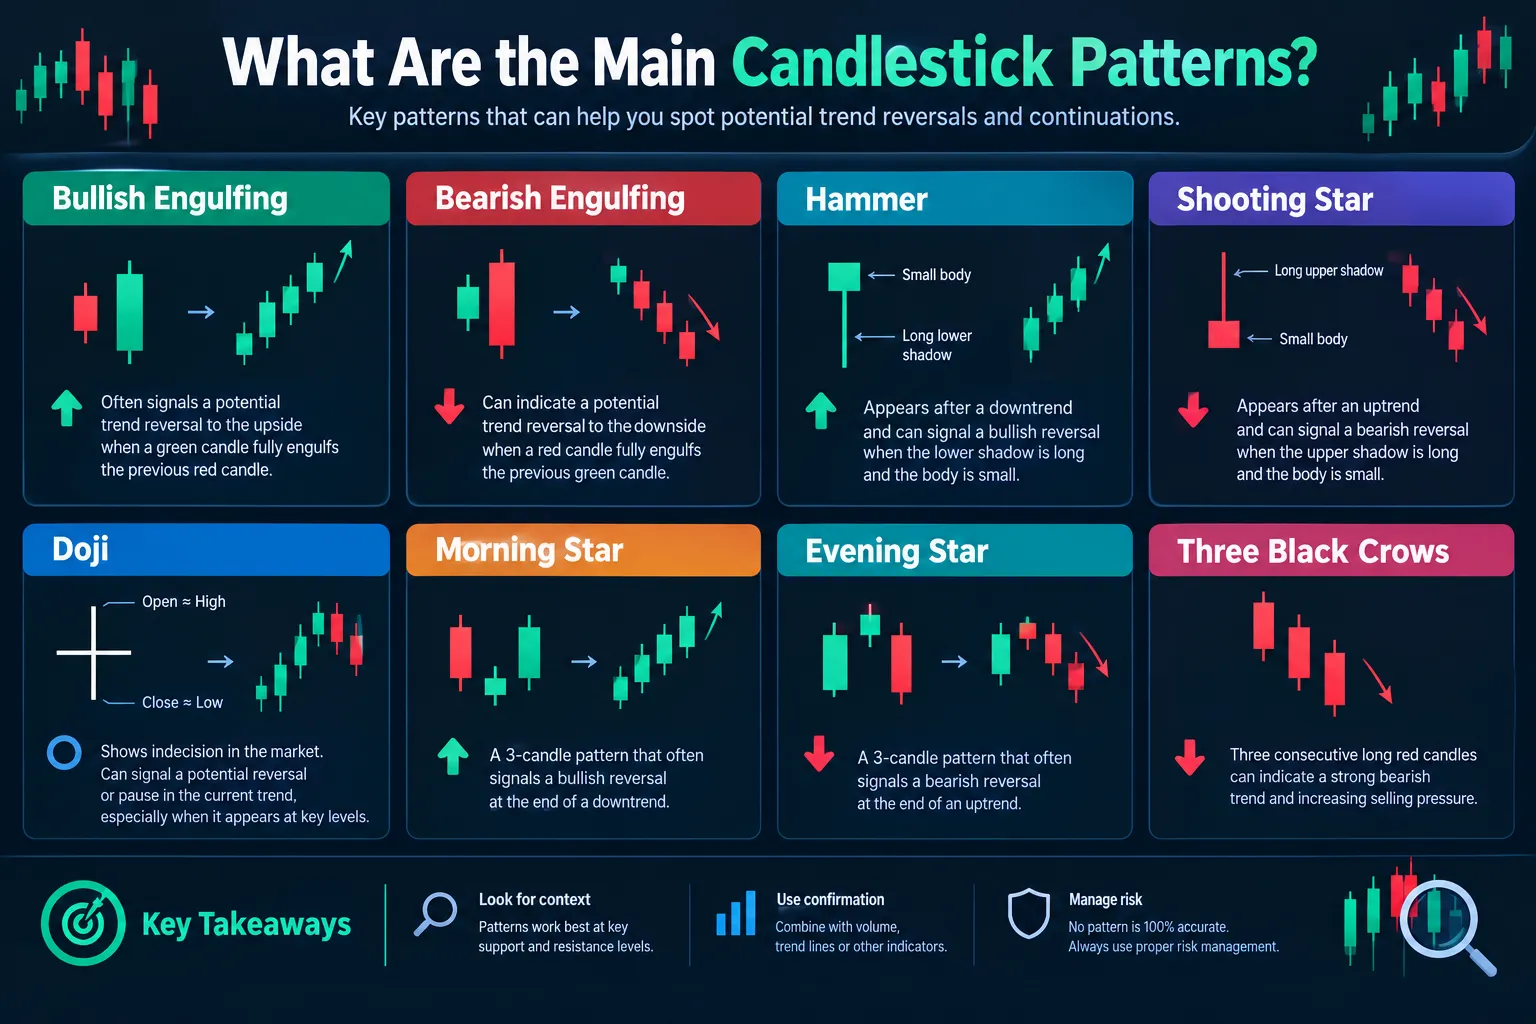
Patterns are shorthand for a behavior, nothing more. Each one below describes what buyers and sellers did. Each one also fails regularly, which is why the failure column exists.
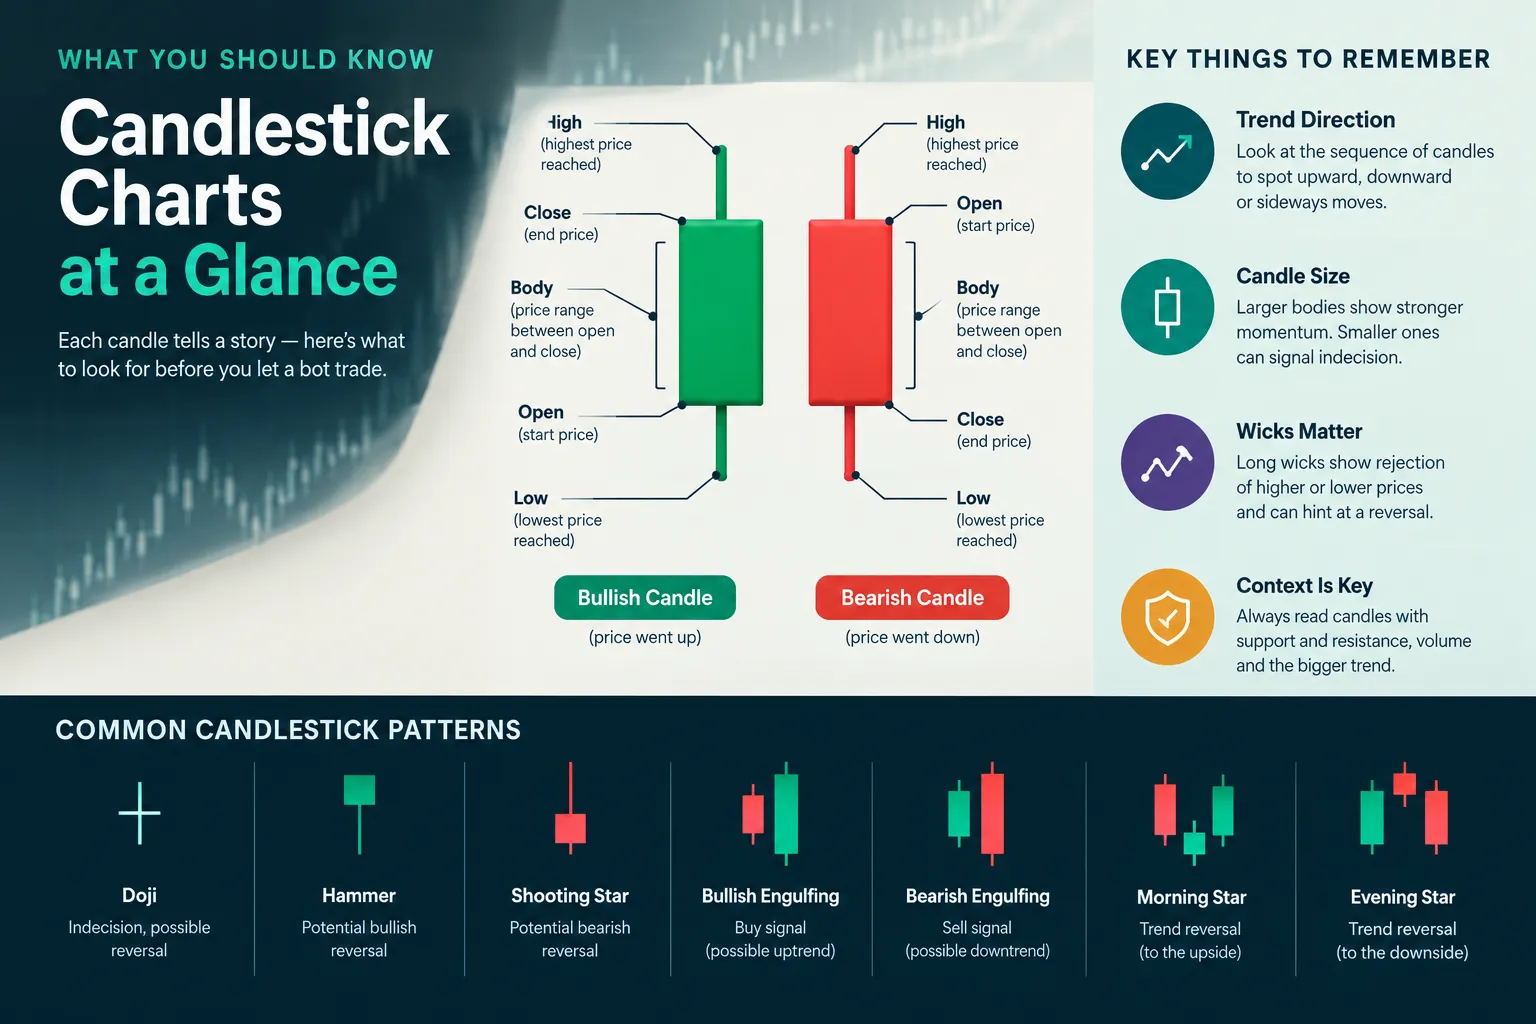
| Pattern | What it looks like | What it suggests | Common failure |
|---|---|---|---|
| Hammer | Small body at the top, lower wick at least twice the body, little or no upper wick | Sellers drove price down and got overwhelmed; possible downtrend exhaustion | Appears mid-downtrend with no support below. Price keeps falling. Classic catching a falling knife |
| Bullish engulfing | A green body that fully covers the prior red body | Buyers took the whole prior session back in one period | Prints into overhead resistance on thin volume, then stalls immediately |
| Bearish engulfing | A red body that fully covers the prior green body | Sellers reversed the prior session’s gain | Shows up inside a strong uptrend as normal profit-taking, not a top |
| Doji | Open and close nearly equal, thin line body, wicks both sides | Indecision; neither side could hold ground | Treated as a reversal when it’s just a low-volume lunch-hour candle |
| Shooting star | Small body at the bottom, long upper wick, little lower wick | Buyers pushed, sellers slammed it back; possible uptrend exhaustion | Appears after a modest move with no prior extension, so there’s nothing to reverse |
| Morning star | Three candles: big red, small-bodied candle, big green closing well into the first | Downside momentum stalled and flipped | The third candle gaps up and gets sold; the whole structure fails on the next open |
What is a hammer candlestick?
A hammer is a single candle with a small real body near the top of its range and a lower wick at least twice the body’s length. It says sellers pressed hard inside the period and buyers absorbed the whole flush before the close.
A hammer means something after a sustained decline, at a level price has respected before, on elevated volume. A hammer floating in the middle of nowhere on a quiet 1-minute chart is noise with a nickname.
Do you need to memorize Japanese candlestick patterns to trade?
No. Steve Nison’s catalog runs past 50 named patterns, and most traders use five or six.
Memorizing names does not produce an edge. Understanding the mechanic does. If you grasp that a long lower wick equals absorbed selling, you’ve already got hammer, dragonfly doji, and the bullish pin bar covered without flashcards. Learn the mechanic, skip the vocabulary test.
What are the most common candlestick patterns traders look for?
In practice, the short list is: engulfing (both directions), hammer and shooting star, doji, inside bar (a candle whose entire range sits inside the prior candle’s range, which signals tight consolidation), and the three-candle star formations.
Decision rule: if you can’t explain in one sentence what buyers and sellers did to produce the shape, don’t trade it.
How Do You Read a Candlestick Chart for Day Trading?
For day trading, read the higher timeframe first for direction, then drop down for entry timing. Most intraday traders anchor on the daily chart, then execute on the 5-minute or 15-minute. The candle you trade should never be the only candle you’ve looked at.
What timeframe should I use when reading candlesticks?
Match the timeframe to your holding period. A rough map:
| Holding period | Context chart | Execution chart |
|---|---|---|
| Minutes (scalping) | 15-minute | 1-minute |
| Intraday (hours) | Daily | 5-minute |
| Swing (days to weeks) | Weekly | Daily |
| Position (weeks to months) | Monthly | Weekly |
The common mistake is reading a 1-minute hammer and treating it like a daily reversal. A 1-minute candle on a mid-cap stock might represent 2,000 shares. The daily candle represents millions. Same shape, wildly different weight.
How does volume change what a candle means?
Volume is the vote count behind the candle. A bullish engulfing bar on triple average volume means institutions participated. The same shape on 30% of average volume means a few retail orders bumped into a thin book.
Three volume rules worth running:
- A reversal candle without above-average volume is a suggestion, not a signal.
- A breakout candle on weak volume is where bull traps live. Price clears resistance, no one follows, it rolls back under. Textbook.
- Volume dries up during tight consolidation, then expands on the break. That expansion is the confirmation.
What about context around the candle?
Four context checks before any intraday read:
- Time of day. The first 15 minutes and the last hour carry the real volume. The 11:30 a.m. to 1:30 p.m. window is a choppy tape where patterns misfire constantly.
- Level. Is the candle forming at a prior high, a prior low, a gap fill, or in open air? Patterns at levels matter. Patterns in open air rarely do.
- Extension. A reversal candle after a stock has already run 15% in two days is a different animal from one after a 2% drift. Overextended moves snap back harder.
- Spread and liquidity. A low float name with a $0.14 bid-ask spread will eat your edge regardless of how clean the setup looks.
Can you read candlesticks on any currency pair or just major ones?
You can read candles on any instrument that reports open, high, low, and close, including exotic currency pairs, small-cap stocks, and futures contracts. Reliability drops as liquidity drops, though.
On EUR/USD or SPY, a candle reflects enormous two-sided participation. On a thin pair or a $40 million market-cap stock, a single large order can print a dramatic-looking hammer that means nothing. The shape is identical. The information content is not.
Decision rule: if average daily volume can’t absorb your position size ten times over, the candles aren’t telling you about the market. They’re telling you about one trader.
Does TradingView Have a Candlestick Pattern Indicator?
Yes. TradingView includes built-in candlestick pattern detection you can add from the indicator menu, and its public script library contains many community-built pattern scanners. For current feature availability on your plan tier, check the official TradingView pricing and features page.
What the built-in tools actually do:
- Scan visible bars and flag matches for named patterns like engulfing, hammer, doji, and morning star with a label on the chart.
- Let you add individual pattern indicators or an “All Candlestick Patterns” style detector.
- Feed into Pine Script, TradingView’s own scripting language, so you can code conditions like
close > open and close > openyourself.
What they do not do:
- Judge context. The detector flags a hammer in a downtrend and a hammer in dead air identically.
- Confirm volume, trend regime, or whether you’re buying directly into resistance.
- Place orders on their own. TradingView automation is mostly an alert-and-webhook architecture: a Pine Script strategy fires an alert, sends a JSON webhook, and a broker API or third-party bridge submits the order. That chain adds latency and another failure point between the candle close and your fill.
If you’re building your own detection logic, our Pine Script tutorial covers the syntax for coding pattern conditions from scratch.
What Is the Pre-Trade Checklist Before Any Bot Trade?
Six checks, in order, every time. If any one fails, the trade doesn’t happen. The point of a checklist isn’t to find trades. It’s to reject the ones that look good and aren’t.
1. Trend: which direction is the higher timeframe pointing?
Check: Is the instrument above or below its 50-day and 200-day moving average, and is the higher timeframe making higher highs or lower lows?
Common failure: Bots buy bullish engulfing patterns in sustained downtrends all day long. The pattern prints, the bot fills, the downtrend resumes.
The fix: Add a regime filter. No long signals when price is below the 200-day. No short signals above it. One line of code, and it removes a large share of your worst losers. The trend is your friend right up until you code against it.
2. Level: is the candle forming somewhere that matters?
Check: Is there identifiable support or resistance within one ATR (average true range, a measure of typical daily movement) of the entry?
Common failure: Entering a long on a clean hammer that sits three cents under a six-month resistance shelf. The pattern is valid. The location is terrible.
The fix: Code a rejection rule. If overhead resistance sits closer than your profit target, skip the trade. The risk-reward math was already dead before you clicked.
3. Volume: did anyone show up?
Check: Is the signal candle’s volume above its 20-period average?
Common failure: Backtests look great because historical data includes thin-volume candles that would never have filled at the modeled price in live trading.
The fix: Require volume above a set multiple of the average, and require a minimum average daily volume for the instrument itself. Thin names break backtests and accounts in the same way.
4. News: is there a scheduled event in the window?
Check: Earnings date, Fed announcement, CPI release, FDA decision, scheduled guidance. Anything that can gap the instrument past your stop.
Common failure: A bot holds a position through an earnings release because the pattern logic didn’t know what earnings season is. The gap down opens below the stop, and the stop fills wherever it fills.
The fix: Build an exclusion calendar. No new entries within 48 hours of a scheduled catalyst unless event risk is the actual strategy. Flat into the unknown beats clever into the unknown.
5. Size: how much is this trade allowed to cost?
Check: Does the position size cap your loss at a fixed small percentage of account equity if the stop hits?
Common failure: Position sizing by share count instead of by risk. Trading 100 shares of everything means a $12 stock and a $400 stock carry wildly different risk.
The fix: Size from the stop. Risk amount divided by stop distance equals share count. If you only read one more thing today, make it the position sizing mistake that wipes out new traders, because this check saves more accounts than every pattern in this article combined.
6. Stop: where is the trade wrong, and is the exit live?
Check: Is the stop placed at a price that invalidates the pattern (usually just beyond the signal candle’s wick), and is the exit order resting at the broker rather than living in your bot’s memory?
Common failure: A “mental stop” inside a script that stops running when the VPS reboots or the webhook times out. The position has no protection and no one notices for an hour.
The fix: Place a hard stop order at the broker on entry. Separately, run a kill switch that flattens everything if the bot loses its data feed. FINRA Regulatory Notice 15-09 covers exactly this territory, calling for testing before production and continued testing after deployment or any material change.
The checklist in short form
| # | Check | Pass condition |
|---|---|---|
| 1 | Trend | Signal agrees with higher-timeframe direction |
| 2 | Level | Clear room to target, no resistance in the path |
| 3 | Volume | Signal candle above 20-period average volume |
| 4 | News | No scheduled catalyst inside the holding window |
| 5 | Size | Loss at stop capped at a fixed percentage of equity |
| 6 | Stop | Hard order resting at the broker, not in a script |
Six passes means you trade. Five means you don’t. There is no partial credit.
If you’re assembling a bot from scratch, trading bot basics covers the architecture that sits underneath this checklist.
What Is the Most Profitable Candlestick Pattern?
There isn’t one. No single candlestick pattern produces reliable profit on its own, and the published research doesn’t agree on whether patterns generate durable excess returns at all.
Here’s what the literature reports:
- The 2026 African Journal of Scientific Research paper found accuracy ranging from 59.86% for the hammer down to 41.56% for the hanging man, with bearish engulfing at 42.39%. Several patterns performed worse than a coin flip.
- A University of Luxembourg study reported success rates between 48% and 58%, averaging 51% for bullish patterns and 49% for bearish, and concluded that short holding-period signals were not profitable once properly tested.
- A study published in PLOS One reports that filtered two-day patterns produced historical annual returns as high as 36.73% with a Sharpe ratio of 0.81 and an information ratio of 2.37. Note the word filtered. The filters did the work.
- A 2026 paper in the International Journal of Advanced Computer Science and Applications used machine learning on candlestick-derived inputs and reported a three-day mean absolute error of 0.0366 for Ridge Regression, while stating plainly that forecasting accuracy did not guarantee profitable trading.
Read those together and the pattern behind the patterns is obvious: the shape is a weak input. The filter, the stop, and the position size determine whether you keep money.
Can you predict price movements just from reading candlestick patterns?
No. A candle pattern is a conditional observation, not a forecast. The identical hammer can resolve up or down depending on trend regime, nearby support and resistance, volume, spread, volatility, and the behavior of the next candle.
A pattern tells you what already happened. The market owes you nothing for noticing.
Treat patterns the way a doctor treats a symptom: useful, suggestive, meaningless without the rest of the chart.
Why Do Bots Misread Candlestick Patterns?
Bots misread candles because they match shapes without judging conditions. Three failure modes cause most of it: repainting, timeframe mismatch, and missing context.
Repainting
A repainting indicator changes its historical signals after the fact. A pattern detector that evaluates the current, unfinished candle will flag a hammer mid-bar, then un-flag it when the candle closes differently. Your backtest sees only the final, flattering version.
The fix: evaluate on confirmed closes only. In Pine Script, that means using barstate.isconfirmed rather than acting on live bars. If your backtest results collapse when you make that change, the results were never real.
Timeframe mismatch
A bot coded on daily candles and deployed on 5-minute candles isn’t the same strategy. Noise scales inversely with timeframe. Patterns that survive on daily bars get buried in intraday spread and random ticks.
The fix: test on the exact timeframe you’ll run, with realistic spread and commission assumptions baked in.
Missing context
This is the big one. A pattern detector that fires on shape alone has no idea the market is in a drawdown, that earnings drop tomorrow, or that price is sitting under a wall of supply. FINRA’s AI guidance recommends validating inputs, logic, parameters, and outputs, including data quality, algorithmic errors, risk thresholds, explainability, and testing under stressed or unprecedented market conditions. For a candlestick bot, that means checking timestamp alignment, OHLC data integrity, pattern definitions, and behavior during gaps and extreme volatility.
Day Trade Warrior’s YouTube channel, which features Ross Cameron, publishes explainer videos on candlestick reading for intraday traders, framed around chart context rather than pattern shapes alone.
Regulators aren’t treating AI trading bots as a new category, either. Current guidance frames them as algorithmic trading systems with existing obligations around testing, pre-trade controls, recordkeeping, and monitoring, under frameworks including MiFID II Article 17 and RTS 6 in the EU, FCA MAR 7A in the UK, and electronic-trading controls in the US. The CFTC Innovation Task Force’s Frontier Forum on AI and agentic finance, scheduled for October 28, 2026, addresses AI systems that execute trades under existing derivatives rules.
The legal line stays conduct-based: running a bot on your own account differs from managing other people’s money, giving individualized advice, or engaging in spoofing, layering, or wash trading. Automation does not transfer responsibility away from you.
And a practical warning, separate from the law: a report updated October 20, 2026 on AI trading bot scams recommends verifying registration, custody, and withdrawal terms independently through FINRA BrokerCheck, SEC IAPD, or NFA BASIC. Promised returns and withdrawal friction are the two loudest red flags. Play stupid games.
What’s the best platform or tool for reading candlestick charts?
For charting itself, TradingView is the default for most retail traders because of its chart quality, alert system, and Pine Script. StockCharts is the long-running alternative with strong technical overlays, covered in our StockCharts.com review. For execution-side candle reading, your broker’s platform matters more than any third-party tool, because that’s where the fills happen.
Decision rule: pick one charting platform and one execution platform. Running four scanners and three Discords isn’t research, it’s analysis paralysis with a subscription bill.
How Do You Practice Reading Candles Safely?
Paper trade it first, then use replay mode. Both let you build pattern recognition without real money funding the tuition.
Paper trading is simulated trading with live market data and fake capital. Most brokers offer it. It teaches order mechanics, platform muscle memory, and whether your checklist survives contact with a live tape. Our guide to the best paper trading apps covers the options worth your time.
Bar replay is better for pure chart reading. TradingView and several desktop platforms let you rewind a chart to an arbitrary date and step forward one candle at a time. You see the hammer form without knowing what happens next. That’s the only honest way to practice, because reading a historical chart with the outcome visible to the right teaches nothing except hindsight.
A practice routine that works:
- Pick one instrument and one timeframe. Stay there for 30 sessions.
- Replay 50 setups. For each, write down the pattern, the trend, the level, the volume read, and your predicted direction before stepping forward.
- Score yourself. Not on win rate, on checklist compliance. Did you run all six checks?
- Only then paper trade live, same instrument, same timeframe.
- Go live small. Smallest size your broker allows.
How long does it take to get good at reading candlesticks?
Reading a candle accurately takes an afternoon. Reading candles in context well enough to trade them takes most people six to twelve months of consistent screen time, assuming daily practice and a written journal.
No one can hand you a verified number here, and anyone who does is selling something. What’s observable is that traders who journal every setup and review weekly progress faster than those who don’t, because the feedback loop closes. Journaling tools like TradeZella exist specifically for that loop.
Screen time without review isn’t experience. It’s repetition.
What are the biggest mistakes people make reading candlestick charts?
Seven that show up constantly:
- Trading the pattern without the trend. The single most expensive error.
- Acting on unconfirmed candles. The shape isn’t real until the bar closes.
- Ignoring volume. Shape without participation is decoration.
- Dropping to lower timeframes after a loss. Faster charts feel like more opportunity. They’re more noise. This is how revenge trading starts.
- Stacking indicators to confirm what you already decided. Adding filters increases parameter choices and overfitting risk. Three filters that agree isn’t confirmation, it’s the same opinion dressed three ways.
- Treating every doji as a reversal. Most dojis are low-participation pauses.
- Skipping the stop because the pattern “looks clean.” Clean setups fail at roughly the rate messy ones do, just more expensively, because you sized up.
Frequently Asked Questions
How do I read a candlestick chart for day trading?
Read the daily chart for direction, then execute on the 5-minute or 15-minute. Check that the signal candle formed at a real support or resistance level, on above-average volume, outside the low-liquidity midday window. Avoid the 11:30 a.m. to 1:30 p.m. ET chop where intraday patterns misfire most often.
What is a hammer candlestick?
A hammer has a small body near the top of its range and a lower wick at least twice the body’s length, signaling that sellers pushed price down and buyers absorbed it before the close. It carries weight only after a sustained decline, at a level price has respected before. A hammer in the middle of a range is noise.
Does TradingView have a candlestick pattern indicator?
Yes. TradingView offers built-in candlestick pattern detection through its indicator menu, plus a large community script library of pattern scanners. The detectors flag shapes only, with no judgment on trend, volume, or nearby resistance. Check the official TradingView features page for availability on your plan tier.
How can I read candlesticks as a beginner?
Start with a daily chart, remove every indicator, and study only the bars. Learn the body (open to close), the wicks (high and low), and whether the close sits above or below the open. Mark the levels price reacted to more than once, then review what happened after the largest bodies and longest wicks.
What is the most profitable candlestick pattern?
No candlestick pattern is reliably profitable on its own. Published accuracy figures vary widely, from 59.86% for the hammer to 41.56% for the hanging man in a 2026 African Journal of Scientific Research paper, and a University of Luxembourg study found short-hold candlestick signals unprofitable after proper testing. Profitability comes from filters, stops, and position sizing.
Can I read candlesticks on any currency pair?
Yes, on any instrument reporting open, high, low, and close, including exotic pairs and small-cap stocks. Reliability falls as liquidity falls, because one large order can print a dramatic candle in a thin market that would mean nothing in EUR/USD or SPY.
Do candlestick charts work on crypto and futures?
The mechanics are identical anywhere OHLC data exists, including futures contracts. Session structure differs though, since 24-hour markets have no single daily open or close, which changes how daily candles form and how gaps behave.
Our Take
Candles give context, not signals. A hammer isn’t a buy order, it’s a sentence about what buyers and sellers just did, and sentences need paragraphs around them to mean anything. The traders who lose money reading candlestick charts aren’t bad at spotting hammers. They’re skipping trend, level, volume, news, size, and stop, then blaming the pattern when it doesn’t bail them out.
So run the six checks. Every trade, every time, bot or manual. Write them into your script as hard rejections, not suggestions. Then replay 50 setups before a single dollar moves.
Related: more bot reviews and setups live on AI Stock Trading Bots, and if thinkorswim is where you read your charts, see our thinkorswim review on AI Stock Picker App.
Got a candlestick bot you’ve tested and want reviewed against the checklist? Submit it here and we’ll put it through the same framework.
Stay alpha.
The FullStack Alpha research desk tests AI trading bots on paper and live accounts. Reviewed and edited by Jay Rocco, Founder and Editor.
