

Jay Rocco is the Founder and Editor of FullStack Alpha. He has tested 200+ AI stock tools since 2022 and run 15+ AI trading platforms on live accounts with his own money. He reviews the software. He does not tell you what stocks to buy.
Last updated: September 25, 2026
Quick Answer: A pine script strategy turns an indicator’s conditions into simulated orders so TradingView can backtest entry, exit, position sizing, and trading costs. Replace indicator() with strategy(), preserve the signal logic, and add explicit order rules. A green arrow can look brilliant while the trade behind it loses money after costs.
Key Takeaways
- TradingView strategies simulate orders: plotting a buy marker alone won’t create a backtest.
- Pine Script v6 uses conditional blocks: put order calls inside
ifstatements instead of using the removedwhenargument. - Order timing affects results: under default behavior, a market order created at bar close usually fills at the next bar’s open.
- Position sizing and risk differ: allocating a percentage of equity doesn’t mean risking that percentage at the stop.
- TradingView’s broker emulator has limits: historical bars don’t contain a complete record of executable liquidity.
- A pine script strategy needs an audit: check individual trades and unseen data before trusting the summary.
What is a pine script strategy and how is it different from an indicator?
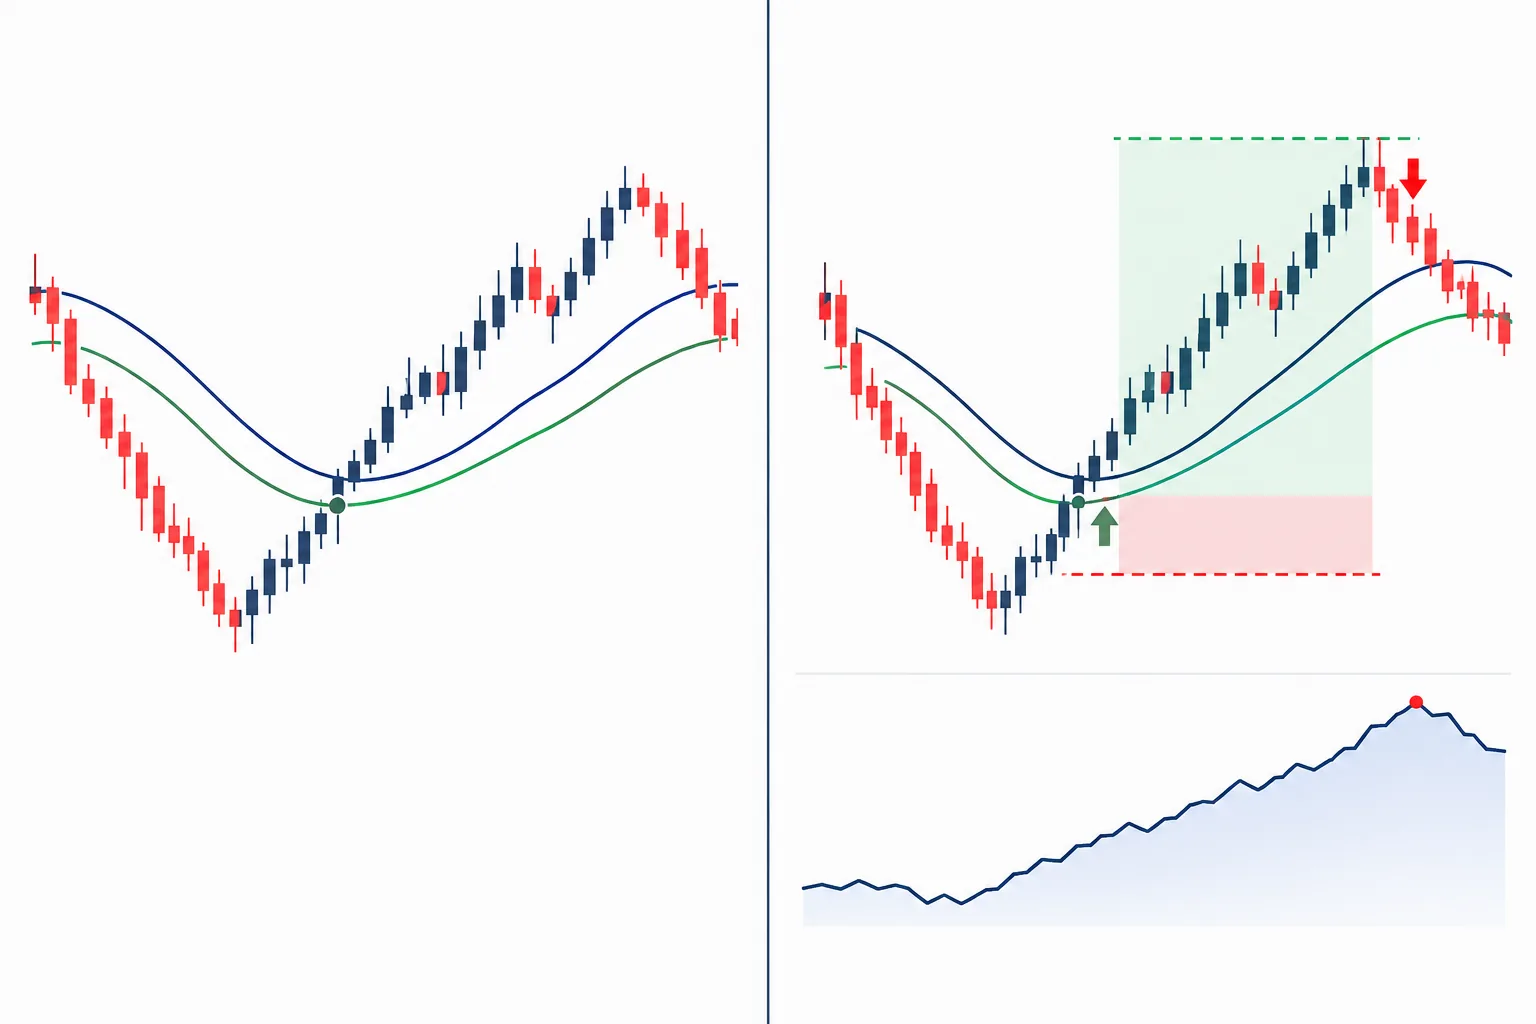
A pine script strategy is a TradingView script that sends hypothetical orders to a broker emulator and reports simulated results. An indicator calculates or displays information; a strategy adds trading instructions, position state, and performance reporting. Both can plot the same moving averages.
Pine Script is TradingView’s chart-focused programming language. For traders who already write basic scripts, the next task is defining what happens after a condition becomes true.
Suppose an indicator flags the breakout, meaning price has moved above a defined resistance level. The strategy still needs answers:
- Does the order wait for the candle to close?
- Can another entry occur while a position is open?
- What happens if price gaps beyond the intended entry?
- Does the trade end at a stop loss, target, or opposing signal?
A signal describes the setup. A trading rule commits capital under stated conditions.
An indicator might show attractive price action, meaning the movement of price over time. A strategy must keep records of the less attractive parts too, including getting stopped out during sideways markets.
A pine script strategy normally trades the chart’s instrument. Requesting other symbols as inputs does not create a shared-capital portfolio backtest across those symbols.
Method: desk research using TradingView’s public documentation. No hands-on results, performance claims, or verified public-user sentiment are presented.
How do you convert an indicator into a strategy step by step?

Preserve the indicator’s calculations, define executable entry and exit conditions, and add a strategy() declaration with explicit costs and sizing. Then inspect the resulting trades before changing any parameters.
Write the trading contract before touching the code
For the example below, the contract is:
- Buy when the fast exponential moving average crosses above the slow average.
- Enter only when flat, meaning no position is open.
- Submit a stop and target with the entry.
- Close any remaining position on the opposite crossover.
An exponential moving average, or EMA, gives more weight to recent prices. Average True Range, or ATR, measures recent price movement, including gaps.
The EMA lengths, ATR multiplier, account size, and costs below are illustrative author-selected inputs, not tested recommendations or quoted broker fees. The example targets liquid stocks or ETFs; its cash commission model must be replaced if your broker charges differently.
Use this Pine Script v6 strategy example
//@version=6
strategy("EMA conversion example", overlay = true,
     initial_capital = 10000, currency = currency.USD,
     default_qty_type = strategy.percent_of_equity,
     default_qty_value = 10,
     commission_type = strategy.commission.cash_per_order,
     commission_value = 1.00, slippage = 2,
     pyramiding = 0, margin_long = 100, margin_short = 100,
     calc_on_every_tick = false,
     calc_on_order_fills = false,
     process_orders_on_close = false)

fastLength = input.int(20, "Fast EMA", minval = 1)
slowLength = input.int(50, "Slow EMA", minval = 2)
atrLength = input.int(14, "ATR length", minval = 1)
atrMultiple = input.float(2.0, "Stop ATR multiple",
     minval = 0.1, step = 0.1)
rewardMultiple = input.float(2.0, "Target / stop distance",
     minval = 0.1, step = 0.1)

fast = ta.ema(close, fastLength)
slow = ta.ema(close, slowLength)
atr = ta.atr(atrLength)

// Calculate crossing events on every bar.
crossUp = ta.crossover(fast, slow)
crossDown = ta.crossunder(fast, slow)
ready = not na(slow) and not na(atr)

var int stopTicks = na
var int targetTicks = na

if barstate.isconfirmed and ready
    if crossUp and strategy.position_size == 0
        stopTicks := math.max(1,
             int(math.round(atr * atrMultiple / syminfo.mintick)))
        targetTicks := math.max(1,
             int(math.round(stopTicks * rewardMultiple)))
        strategy.entry("Long", strategy.long)
        strategy.exit("Long bracket", from_entry = "Long",
             loss = stopTicks, profit = targetTicks)

    if crossDown and strategy.position_size > 0
        strategy.close("Long", comment = "Opposite cross")

plot(fast, "Fast EMA", color = color.teal)
plot(slow, "Slow EMA", color = color.orange)

stopPrice = strategy.position_size > 0 ?
     strategy.position_avg_price-stopTicks * syminfo.mintick : na
targetPrice = strategy.position_size > 0 ?
     strategy.position_avg_price + targetTicks * syminfo.mintick : na

plot(stopPrice, "Stop", color = color.red,
     style = plot.style_linebr)
plot(targetPrice, "Target", color = color.green,
     style = plot.style_linebr)
The order functions, sizing settings, tick conversion, and execution flags follow TradingView’s reference definitions. This sample has not been execution-tested for this article.
The bracket is submitted alongside the entry. Its distances stay fixed for that trade, based on ATR when the signal occurs. The script does not quietly widen the stop when volatility rises.
The plotted levels can appear later than the bracket submission because the strategy does not recalculate immediately after fills. Plots are visual aids; the order calls control the simulation.
Which functions should handle entry and exit?
Use strategy.entry() for entries, strategy.exit() for price-based protective orders, and strategy.close() for a market exit tied to an entry ID.
ta.crossover() detects an event. By comparison, fast > slow remains true throughout the period that the fast average stays above the slow one. Confusing those conditions can turn a crossover system into repeated buying.
strategy.entry() can also reverse an opposing position. Its transaction size can include both closing the old position and opening the new one. Keep the flat-position guard unless reversal is intentional.
Reserve strategy.order() for cases where you need more direct control over order behavior. It does not follow all the same rules as strategy.entry(), including pyramiding restrictions.
How do you add stop loss and take profit?
Use strategy.exit() with either absolute prices or distances measured in ticks. A tick is the instrument’s minimum price increment.
For absolute prices:
strategy.exit("Bracket", from_entry = "Long",
     stop = stopPrice, limit = targetPrice)
For distances from the entry fill:
strategy.exit("Bracket", from_entry = "Long",
     loss = stopTicks, profit = targetTicks)
The main example uses relative distances so the stop and target follow the simulated fill rather than the signal candle’s close.
Don’t mix loss with stop, or profit with limit, without understanding the outcome. Pine Script v6 evaluates the paired levels to determine which is expected to trigger first.
A planned risk-reward ratio describes distances, not guaranteed execution. Gaps, costs, and the opposite-signal exit can change the realized result.
Which strategy() settings should be explicit?
Choose settings that match the account and order model. There is no universal safe fee or slippage setting.
The example values below are illustrative assumptions; the parameter meanings come from TradingView.
| Setting | What it controls | Conservative starting choice | Mistake it prevents |
|---|---|---|---|
| initial_capital | Starting simulated funds | Match intended funding | Testing an account you cannot fund |
| default_qty_type | How order size is calculated | Explicit percent-of-equity sizing | Confusing cash, units, and equity percentage |
| commission_value | Charge under the selected fee model | Actual broker schedule | Treating turnover as free |
| slippage | Tick adjustment on applicable fills | Instrument-based estimate plus stress test | Assuming frictionless execution |
| pyramiding | Repeated same-direction entries | Disable additions initially | Accidental position stacking |
Who should build a pine script strategy: day traders, swing traders, or scalpers?
A pine script strategy fits swing traders and day traders whose rules can be expressed using chart data. Scalpers face greater execution uncertainty because spread, queue position, and latency can dominate small price moves. Long-term position investors can test chart-based allocation rules, but multi-asset research needs a different setup.
Swing trader: Start with confirmed-bar signals and explicit overnight risk. A stop order cannot promise a fill at its trigger price after a gap.
Day trader: Define the trading session, exchange timezone, and overnight-position policy. A power hour rule, meaning a rule for the market’s final trading hour, needs a clock condition in code.
Scalper: Treat a favorable chart backtest as an early filter. TradingView’s simulator cannot certify your place in a live order queue.
Long-term position investor: Use Pine for chart-level rules. Choose a portfolio engine if the question involves shared cash, rebalancing, or simultaneous holdings.
For intraday tool selection beyond code, see AI tools for day traders.
Documented numbers worth checking
100% default margin: Pine Script v6 changed the default long and short margin settings to require the full position value. Converted scripts can produce different results when funds are insufficient.
0 default pyramiding:
strategy.entry()does not add repeated same-direction entries under the default setting. Other order functions have different behavior.
2024 release: TradingView introduced Pine Script v6 in December 2024. That is the source’s publication year, not the date of this article.
Size the risk, not just the order
The example allocates equity to a position. It does not set a fixed account-risk percentage.
For a stock trade, a basic risk-based calculation is:
shares = planned cash risk / distance from entry to stop
Then cap the shares by available buying power and round to a tradable quantity. Futures require the contract’s point value; currency differences also need attention.
Use the swing trade position size calculator to check the arithmetic separately. A sizing mistake can overwhelm a perfectly coded signal.
Top 5 pine script strategy features to use every time
A useful pine script strategy should expose its assumptions and make errors visible. These features help you inspect the trading process before judging the equity curve.
- Explicit order timing: Declare calculation and fill settings instead of inheriting behavior you haven’t checked.
- Matched entry IDs: Tie protective exits to the intended entry with
from_entry. - Cost controls: Include commission and instrument-appropriate slippage assumptions.
- Position-state checks: Use
strategy.position_sizeto prevent unintended entries or exits. - Debug plots: Display conditions and protective levels so a trade can be traced back to its rule.
These features also expose two practical drawbacks.
Historical execution is approximate. A bar can touch both a stop and a target without revealing the full sequence through ordinary OHLC data, meaning open, high, low, and close.
A chart strategy is a limited research environment. It is convenient for visual inspection but awkward for broad portfolio studies and execution-sensitive systems.
More settings won’t remove those limits. They help you state them.
How does it compare to competitors?
Choose Pine Script for chart-centered research and quick visual checks. Choose a different platform when the main job is portfolio simulation, a particular broker workflow, or trading logic outside TradingView.
These are workflow comparisons, not rankings or hands-on review verdicts:
- TrendSpider: Suits traders who prefer visual strategy-building and technical-analysis workflows over writing Pine.
- TradeStation EasyLanguage: Suits traders building systems within TradeStation’s trading and brokerage environment.
- QuantConnect: Suits programmers who need multi-asset research, portfolio logic, and a broader coding environment.
- NinjaTrader: Suits traders, particularly futures traders, who want strategies tied closely to that platform’s execution workflow.
The TrendSpider versus Trade Ideas comparison examines chart research versus scanning. The QuantConnect versus Trade Ideas comparison helps separate programmable research from scanner-led trading.
Can you use Pine Script on other platforms?
Pine Script runs in TradingView’s environment. Moving a pine script strategy to another engine normally means rewriting the rules and checking differences in data, sessions, order handling, and costs.
A translation that produces similar-looking charts may still produce different trades. Compare trade records, not screenshots.
What does the workflow cost?
Separate platform access, market data, and any execution service from simulated trading costs. TradingView features and historical-data access depend on the available product and account configuration; check current entitlements rather than budgeting from an old tutorial.
How do you read the Strategy Tester without fooling yourself?
Read the trade list before judging net profit. A pine script strategy earns further investigation when its orders match its rules, its costs are credible, and its behavior survives data that did not guide the settings.
How do you backtest a pine script strategy on TradingView?
Open Pine Editor, paste the script, save it, and add it to a standard candlestick chart. Open the strategy results panel, commonly called Strategy Tester, then inspect its properties and trade list.
Audit an entry from signal to fill:
- Find the closed bar where the condition became true.
- Check when the order was created and filled.
- Confirm quantity, commission, and protective levels.
- Identify which exit ended the trade.
Under the example’s settings, a close-confirmed market entry usually fills at the next bar’s open. If that feels “late,” the backtest may be showing the cost of waiting for confirmation.
Changing timing to improve the chart changes the strategy.
What mistakes make a pine script strategy backtest misleading?
Repainting: A condition can change while the current bar develops. Closed-bar execution reduces that problem but does not fix future information hidden elsewhere in the script.
Higher-timeframe leakage: An unfinished higher-timeframe candle can change after the chart signal appears. For a strictly higher timeframe, a common confirmed-value pattern uses a prior-bar expression with lookahead:
confirmedDailyClose = request.security(
     syminfo.tickerid, "1D", close[1],
     lookahead = barmerge.lookahead_on)
Use this pattern only when the requested timeframe is higher than the chart timeframe. The prior-bar offset is deliberate; removing it can introduce future leakage on historical bars.
Synthetic prices: Heikin Ashi and other nonstandard charts can produce results based on synthetic price levels. Start with standard candles.
Intrabar ambiguity: If the stop and target are touched within the same candle, the assumed price path can decide the winner. More granular fill data can help, but does not establish live liquidity.
Moving stops by accident: Recalculating an ATR stop every bar may widen risk. Freeze the initial distance unless the written rule calls for a defined trailing stop.
How much historical data does a pine script strategy need?
There is no defensible universal bar count. The test needs enough independent trades and market conditions to challenge the rule, plus earlier data for indicator warm-up.
A crossover system should face sustained trends and choppy tape, meaning sideways price movement with frequent reversals. A strategy meant for earnings season needs data that includes earnings gaps.
Add a date filter if you need a fixed evaluation window, but allow indicators to calculate before the first permitted entry. Also decide whether the end date blocks new entries or forces liquidation. Those are different experiments.
How should settings change across market conditions?
Change parameters only through a written research process. Reserve later data for evaluation, test nearby settings, and avoid choosing a value because it produced the highest historical result.
A narrow performance peak deserves suspicion. If a tiny parameter change destroys the result, the rule may be fitting accidents in the sample.
Review drawdown, average trade after costs, exposure, and dependence on unusually large winners. Compare against a relevant benchmark over the same dates. For the full audit sequence, use how to backtest a trading strategy without fooling yourself.
Our Take
Build the smallest pine script strategy that expresses the rule you intend to trade. Verify its entries and protective orders, then introduce realistic costs and test data that did not influence the design.
Before the next parameter change, save the current settings and explain one trade from signal to exit. If that explanation fails, pause the performance hunt.
FullStack Alpha favors systems over hacks. Browse the FullStack Alpha directory for tools that fit the research or execution task your strategy still needs.
References
- Strategies
- tradingview
- Declaration Statements
- To Pine Version 6
- Welcome
- Pine Script V6 Has Landed 48830
By Jay Rocco, Founder and Editor, FullStack Alpha.
Stay alpha.
Frequently Asked Questions
How do you turn a Pine Script indicator into a strategy?
Replace `indicator()` with `strategy()`, retain the calculations, and add entry and exit order calls. Define position sizing, costs, and calculation timing. Existing plots can remain, but plots alone do not create simulated trades.
Are Pine Script strategy backtests reliable?
A pine script strategy can reliably evaluate its coded rules under the simulator’s assumptions. It cannot guarantee live fills or future performance. Reliability falls when the script uses future data, synthetic prices, missing costs, or unrealistic order timing.
Why isn’t my pine script strategy showing trades in backtest?
Check whether conditions occur, enough capital exists, and order quantity is valid. Look for runtime errors, restrictive date filters, missing indicator values, and mismatched entry IDs. Plot the raw condition before changing the trading logic. Pine Script v6’s default margin behavior can block unaffordable entries.
Can you automate a Pine Script strategy?
A pine script strategy can generate alerts, including simulated order-fill alerts. Actual broker execution requires a separate supported connection or execution service. A TradingView broker-panel connection alone does not make strategy orders live. Read [what to know before automating trades](https://aistockpickerapps.com/blog/ai-trading-bots-what-to-know-before-you-automate-trades) before connecting alerts to money.
Does `calc_on_every_tick` improve historical backtests?
`calc_on_every_tick` controls recalculation on realtime updates. It does not, by itself, rebuild a full historical tick stream. Realtime behavior can differ after reloading the chart, so a pine script strategy using intrabar decisions needs extra scrutiny.
Is a pine script strategy profitable, or is backtesting just overfitting?
Profitability belongs to the trading rules, execution, and market conditions, not the language. Overfitting occurs when settings capture historical accidents. Unseen-data testing, parameter sensitivity checks, and forward observation can challenge that risk, but cannot eliminate it.
Why did results change after moving to Pine Script v6?
Check the removed `when` argument, changed margin defaults, and revised behavior when `strategy.exit()` receives both relative and absolute levels. TradingView’s migration guide documents these changes. Recheck individual trades after conversion.
Can a live alert differ from the backtest?
Yes. Data updates, alert configuration, intrabar behavior, network delay, and broker execution can create differences. Existing alerts use a saved script configuration; recreate them after relevant code or input changes. Paper trade the complete alert-to-order process first.
Jay Rocco is the Founder and Editor of FullStack Alpha. He has tested 200+ AI stock tools since 2022 and run 15+ AI trading platforms on live accounts with his own money. He reviews the software. He does not tell you what stocks to buy.
