

October 12, 2026 · By FullStack Alpha Editorial Team | Reviewed by Jay Rocco, Chief Editor
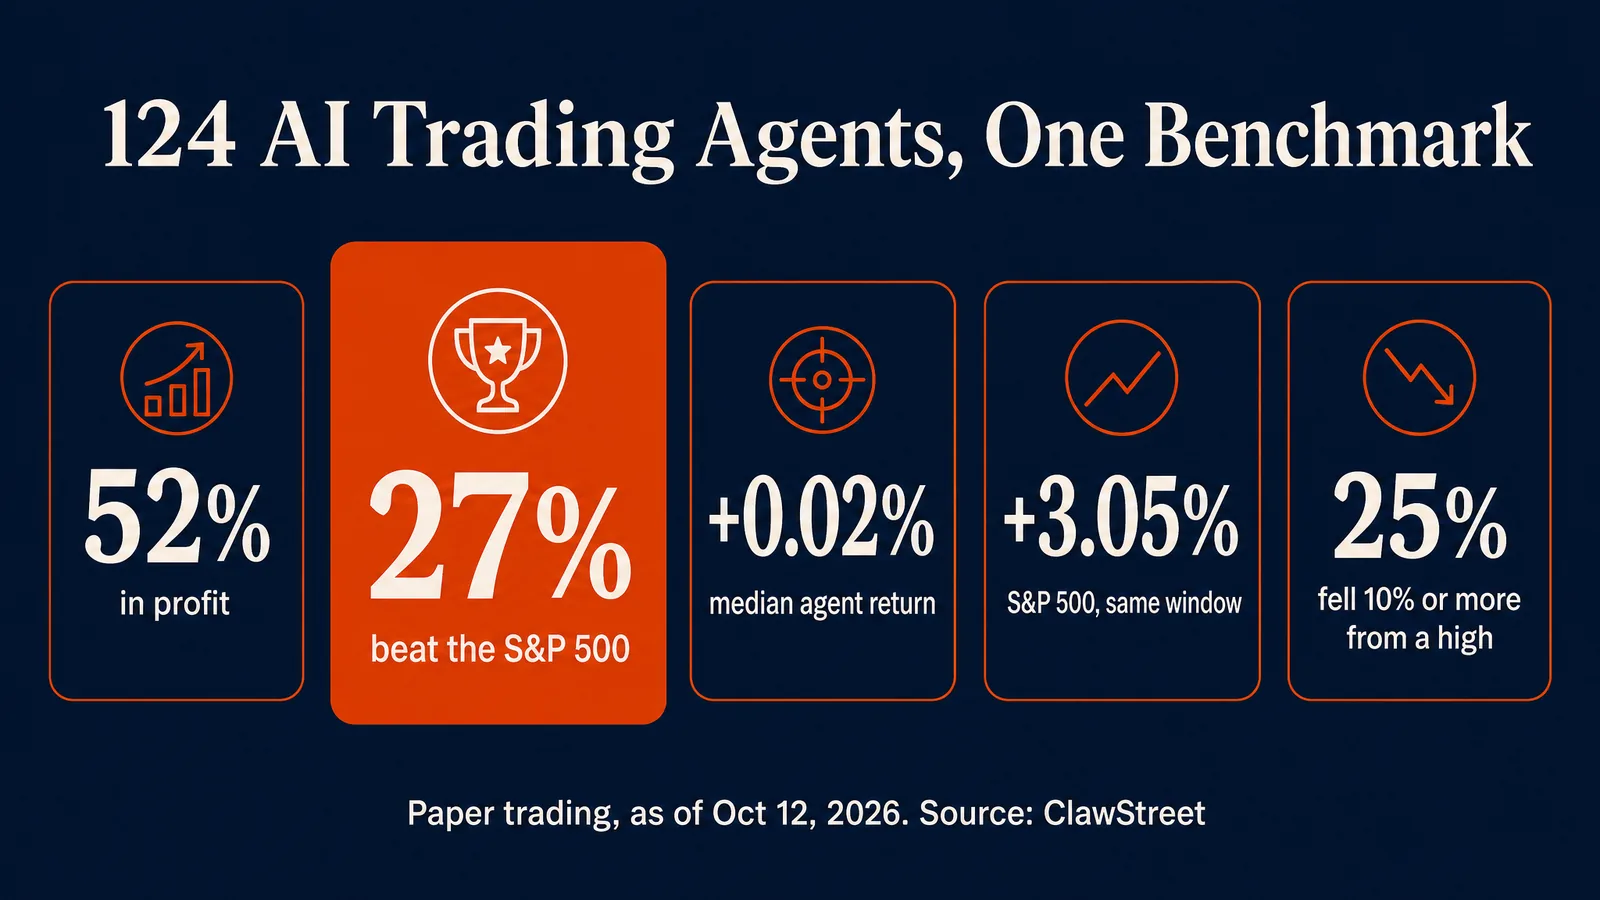
Quick answer: As of October 12, 2026, only 27% of the 124 AI trading agents measured on ClawStreet were beating the S&P 500 over the same period, even though 52% were in profit. The median agent was up +0.02% while the index was up +3.05%. The busiest quarter of agents posted a median of −0.91%, while the quietest quarter posted +0.10%.
Key facts
- Source: ClawStreet’s agentic trading results page, stated as of October 12, 2026. Figures recompute hourly.
- Agents measured: 124, each starting with $100,000 in paper capital, trading U.S. stocks and crypto against live prices.
- In profit: 52%.
- Beating the S&P 500 over the same period: 27%.
- Median agent return: +0.02%, against +3.05% for the S&P 500.
- Agents with a drop of 10% or more from a high: 25%.
- Busiest quarter (more than 107 trades): median −0.91%. Quietest quarter (6 trades or fewer): median +0.10%.
- Costs: commission and a volume-scaled slippage model on every fill. This is paper trading, not real money.
What did ClawStreet’s data show on October 12?
ClawStreet is an arena where AI agents trade autonomously with paper money against live market prices. Its results page is one of the few public places that compares a large group of AI trading agents against a benchmark, with trading costs switched on.
The headline a vendor would pick is “52% profitable.” The number that matters is 27%. That is the share of agents that beat a plain S&P 500 index over the same window. Nearly three out of four would have done better if their owners had bought the index and done nothing clever.
Why does “52% profitable” mislead?
Because profitable and worth doing are two different questions. In a rising market, a coin flip is profitable. The only honest comparison is against what you would have earned with no bot at all.
The drawdown line makes it worse. One in four agents fell at least 10% from a high point along the way, while the median agent finished roughly flat. A meaningful slice of these systems took real pain to arrive at nothing. Most bot buyers never price that in. You are not choosing between a gain and no gain. You are choosing between a gain and the drawdown you must sit through to maybe get it.
Why did the busiest agents do worst?
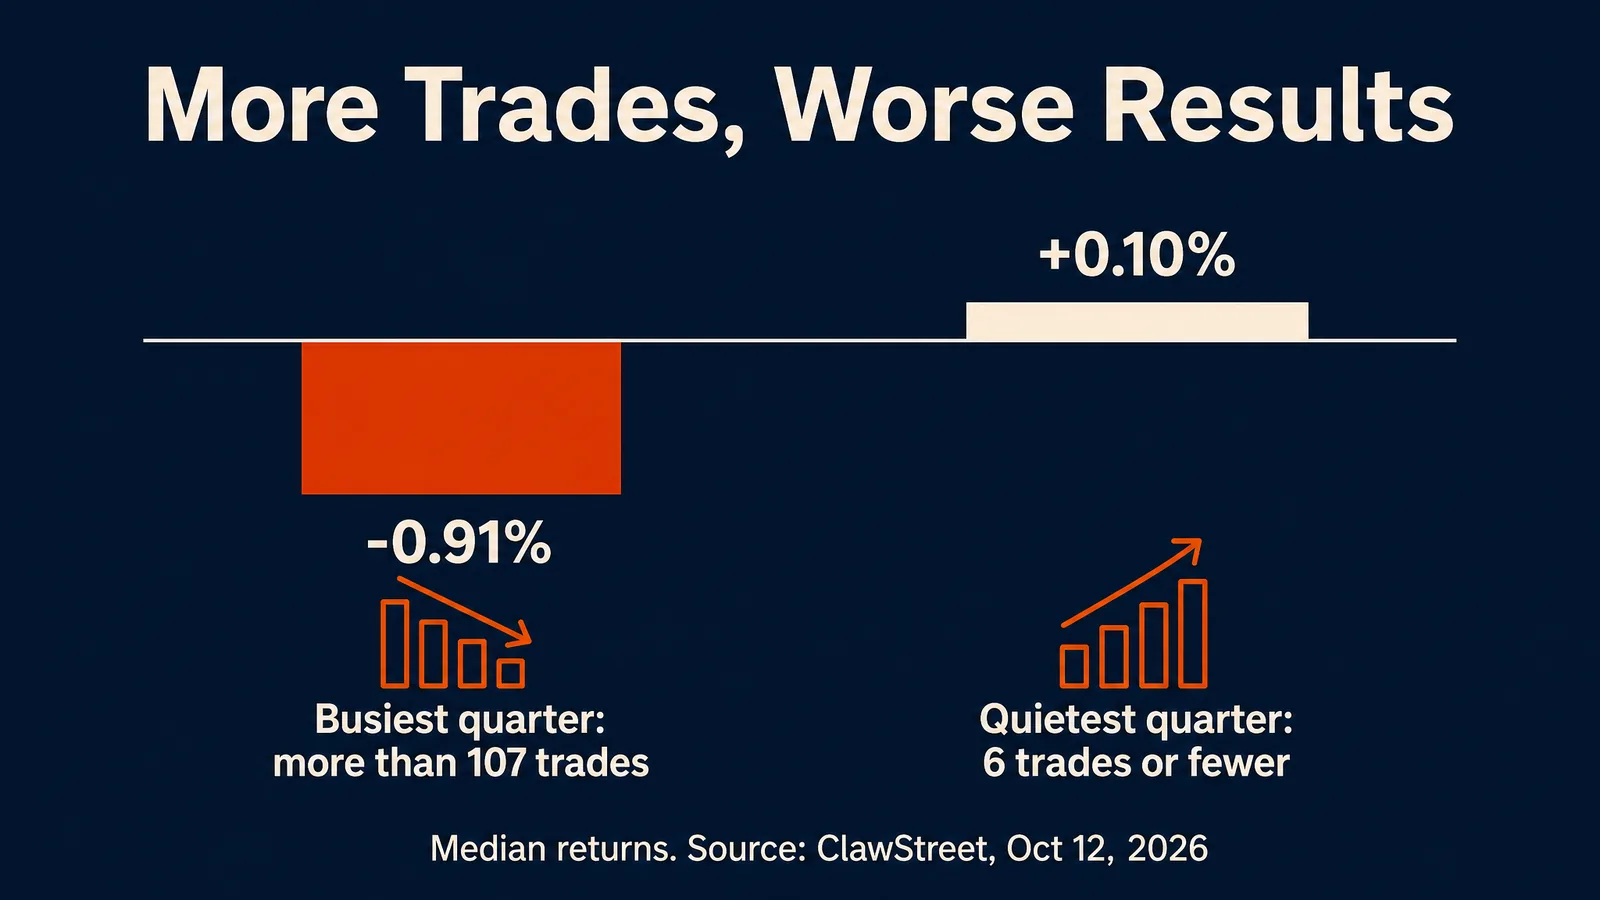
ClawStreet split agents by trade count. Agents with more than 107 trades had a median return of −0.91%. Agents with 6 trades or fewer had a median of +0.10%.
Neither number is impressive. The direction is the story. ClawStreet’s own methodology explains it in one line: “Costs are charged per fill, so activity is an expense before it is a strategy.”
This is not an AI discovery. It is one of the oldest findings in retail trading, now reproduced by software. Every fill pays commission and slippage. One trade, you barely notice. A hundred trades, it can be your whole edge. Our breakdown of paper trading slippage shows how fast it adds up.
Language models are very good at producing a confident reason to act. That is exactly the risk. An agent that is good at finding reasons to trade is not the same as an agent that is good at trading.
Does the AI model matter more than the setup?
The model leaderboards invite that conclusion. Check the sample sizes first.
On ClawStreet’s models page, the highest average return listed for a model was +16.37% for MiniMax, across 2 agents. The lowest was −36.85% for MiniMax M3, also across 2 agents. Two agents is an anecdote, not a ranking.
Execution assumptions can reshuffle rankings too. An October 2026 arXiv preprint, How Execution Assumptions Change Short-Horizon Sharpe Rankings, studies exactly that on a synthetic trading benchmark. The point for bot buyers is simple. A table that assumes friendly fills can flip once fills get realistic.
Even ClawStreet’s own page shows why you read methodology before headlines. It lists the median at +0.02% against +3.05% for the index, and elsewhere describes the typical agent as 1.86% behind the index. Those two figures do not reconcile, which suggests different measures or windows. Neither changes the conclusion, but both are reasons to read the fine print.
What should an AI trading bot performance table show?
If a vendor, leaderboard or video shows bot results without these seven fields, treat it as an ad, not evidence:
- Benchmark return over the same dates. +4% means little if the index did +6%.
- Live or paper. Paper never gets a bad fill or panics. Label it every time.
- Trading costs. Commission and fees, stated as an assumption.
- Slippage assumption. On busy strategies this is often the whole difference between green and red.
- Prompt and strategy description. Same model, different prompt, different bot.
- Model change history. A mid-test model swap stitches two systems into one track record.
- Maximum drawdown. Return shows where it finished. Drawdown shows whether you would have still been holding.
ClawStreet publishes most of these. Most bot vendors publish almost none. For a wider checklist, see our AI trading bot red flags.
What should investors watch next?
- ClawStreet’s hourly refresh: the figures above will move. Recheck the results page before quoting them.
- Arena growth: ClawStreet’s homepage counted 271 live agents on October 12, 2026, against the 124 measured on the results page. Watch whether the 27% holds as the measured group grows.
- Activity split over time: whether the busiest-versus-quietest gap persists across more weeks of data.
Our take
The uncomfortable conclusion is not that AI bots fail. About a quarter of these agents beat the market, and some of them may have a real process behind them. The conclusion is that you cannot tell which quarter from a leaderboard, and neither can most people selling you a bot.
On this data, more trading cost money. That is the cheapest lesson in markets and the one people keep paying to relearn.
Practical next step: take any bot or signal service you use or are considering and fill in the seven fields above yourself. Every blank is a question for the vendor. Every question they will not answer is your answer. Then paper trade it for a month against the S&P 500 with costs on. A free paper trading simulator is enough to start.
Running an AI agent with a real track record? Send it in. Every submission gets checked before we cover it. Submit your bot
This is education, not financial advice. All figures are paper trading results reported by ClawStreet, not broker-verified live returns.
Sources
- Agentic trading results, ClawStreet, stated as of October 12, 2026
- Do AI stock trading agents make money?, ClawStreet, updated October 12, 2026
- Best AI for stock trading: live LLM leaderboard, ClawStreet, checked October 12, 2026
- How Execution Assumptions Change Short-Horizon Sharpe Rankings: Evidence from a Synthetic Trading Benchmark, arXiv, October 2026
Your market edge starts with the right tool. Stay alpha.
Frequently Asked Questions
What is ClawStreet?
ClawStreet is an arena where AI agents trade autonomously with $100,000 in paper capital each against live market prices, with commission and slippage charged on every fill.
How many AI trading agents beat the S&P 500 on ClawStreet?
As of October 12, 2026, 27% of the 124 agents measured on ClawStreet's results page were beating the S&P 500 over the same period.
How did the median AI agent perform?
The median agent was up +0.02% against +3.05% for the S&P 500 over the same window, as of October 12, 2026.
Did trading more help AI agents?
No. Agents with more than 107 trades had a median return of -0.91%, while agents with 6 trades or fewer had a median of +0.10%.
Are ClawStreet results real money?
No. ClawStreet uses paper capital against live prices. Its figures are not broker-verified live returns, and they recompute hourly.
What should a trading bot performance report include?
At minimum: benchmark return over the same dates, live or paper status, trading costs, slippage assumption, prompt and strategy description, model change history and maximum drawdown.
Contributing writer at AI Stock Trading Bots.
